
Oil, Inflation, and Earnings: A Market Balancing Act
LPL Research
Last Updated: July 29, 2026
Today’s blog is written by Chris Fasciano, chief market strategist at Commonwealth. He represents Commonwealth in various media appearances, advisor speaking events, and Commonwealth conferences. He also oversees and mentors a dynamic team of investment research analysts who specialize in equity and fixed income markets. Prior to this role, Chris spent 10 years as one of the firm’s portfolio managers, involved with asset allocation and fund selection. With a deep background in small- and mid-cap stock research, Chris is uniquely positioned to analyze the latest economic data and offer valuable insights on navigating today’s volatile markets. Chris Fasciano is a guest writer and is not affiliated with LPL Financial.
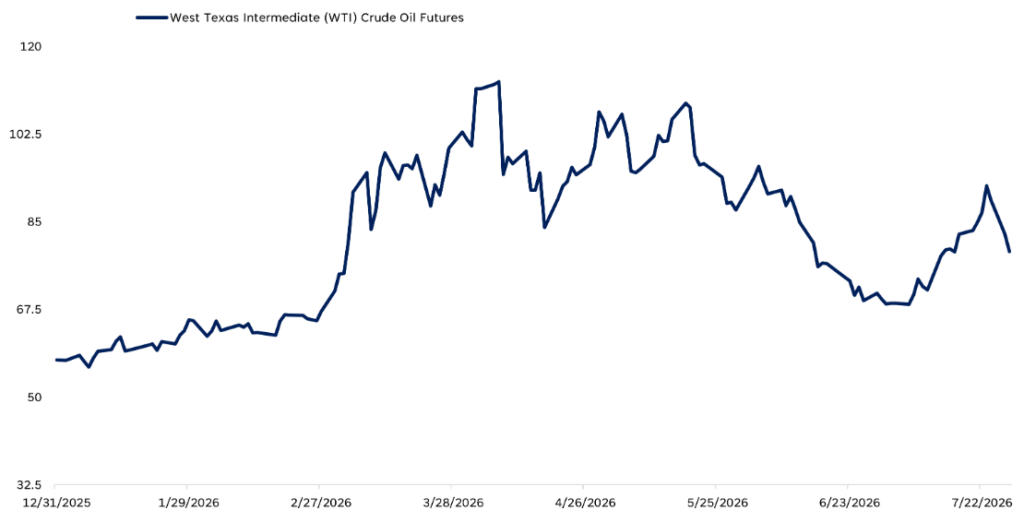
Despite earnings broadly exceeding expectations, equity markets have experienced increased volatility in July. Policy has once again been the biggest driver of market action. And this time it is a familiar headline, with the Middle East, the Strait of Hormuz, and oil prices taking center stage. Less than a month ago, following the signing of the Memorandum of Understanding (MOU), market participants increasingly priced in the likelihood of a final agreement that would fully reopen the Strait. West Texas Intermediate (WTI) oil prices dropped back to levels not seen since the war began.
Unfortunately, that scenario has not played out. The market is now trying to figure out what the end game is in the Middle East and when it will happen. At least in the short term, corporate fundamentals have taken a back seat.
Geopolitical Risk Never Went Away
When an optimistic outlook becomes the consensus view, markets often rally. However, it also leads to the possibility that headlines will challenge that view and set up the potential for disappointment for the market. Three weeks after bottoming at the same level seen in February prior to the start of the war, oil prices rallied and approached $95 a barrel. Hindsight is always 20/20. The MOU failed to generate meaningful progress; the ceasefire came to an end; military action escalated; and crude oil shipments through the Strait have remained below levels needed to meaningfully ease pressure on global supplies and prices.
West Texas Oil Prices Have Been Quite Volatile
Source: LPL Research, Bloomberg 07/28/26
Disclosures: Indexes are unmanaged and cannot be invested in directly. Past performance is no guarantee of future results. Estimates may not develop as predicted and are subject to change.
The “West Texas Oil Prices Have Been Quite Volatile” chart illustrates the fast and sometimes violent movements in oil markets over the course of the year. Given that backdrop, it is easy to understand why some volatility has occurred recently. At the same time, investors certainly aren’t as concerned as they were earlier in the year. Part of this is because progress was made toward ending the conflict to get an MOU signed in the first place. But the longer it takes to get to a deal, and oil prices remain elevated, the potential to impact economic data rises.
Conversely, developments over the weekend indicated a halt to military actions. If this leads to further talks that result in progress toward ending the war and opening the Strait, oil prices can decline quickly.
But the Federal Reserve (Fed) and the bond market might not be so quick to change their views.
Chairman Warsh Confirms Inflation is Still the Focus
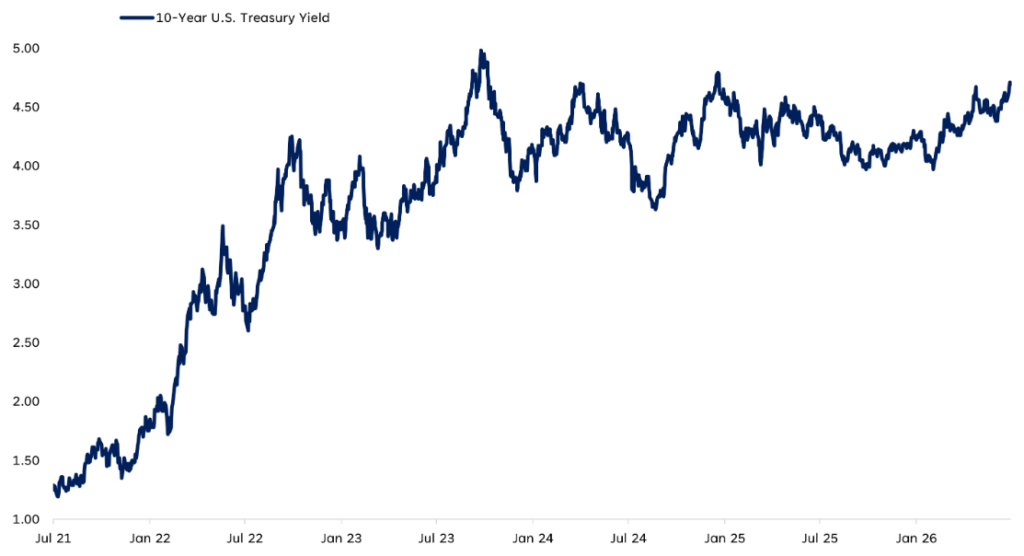
Since becoming Fed Chair, Kevin Warsh has consistently emphasized the committee’s commitment to reducing inflation rather than reacting to short-term fluctuations in oil prices. In recent testimony in front of Congress, Warsh reiterated the Fed’s commitment to bringing down inflation. Warsh stated that the committee has “zero tolerance” for sustained inflation and remains committed to restoring price stability. When asked how he defined price stability, he said that it is price increases that households and businesses “don’t have to think about it.” That is certainly not the landscape that the Fed is dealing with now. The Fed’s dilemma is that core goods that don’t necessarily move in lock step with energy prices remain sticky, in part due to tariffs. Bond market pricing suggests investors have taken that message seriously.
10-Year Treasury Yields Moving Higher
Source: LPL Research, Board of Governors of the Federal Reserve via FRED 07/28/26
Disclosures: Past performance is no guarantee of future results.
The “10-Year Treasury Yields Moving Higher” chart highlights that yields on the 10-year Treasury traded briefly above 4.7% last week for the first time in 18 months. This move up was certainly driven in part by the rise in oil prices. However, as prices have dropped over the last few days, yields have declined but not by a lot and remain over 4.6%. This afternoon’s Fed decision on short-term interest rates will certainly capture the attention of investors. While expectations are that the committee will leave interest rates unchanged for now, an increase isn’t completely out of the question. And that increase remains very much on the table for September.
If the Fed can achieve its goal over the long-term it will bring relief to consumers and increase purchasing power. But it is likely to take higher interest rates and some time to accomplish.
Earnings Continue to Be Strong
Given developments in the Middle East and the prospect of higher interest rates, one might expect a broader market sell-off. But recent stock market performance looks more like a rotation than a liquidation. A key reason market weakness has remained orderly is that corporate fundamentals continue to be strong. The bulk of S&P 500 companies still need to report second quarter earnings, including some high-profile Magnificent Seven stocks this week. However, so far, earnings growth has been better than the already lofty expectations for 22% growth to begin the quarter. While the current reported growth rate of 37.9% was impacted by a sizable gain that Alphabet (GOOG/L) had on equity stakes, FactSet estimates that even excluding that benefit, earnings growth for the quarter is approaching 26%. This would represent back-to-back quarters of over 20% earnings growth for the index. Such results are particularly notable given the current macroeconomic environment.
While headlines can certainly cause short-term market dislocations, over the long-term fundamentals drive returns. And market participants seem to understand that.
Action Under the Surface Remains Solid and Should Benefit Broadly Invested Portfolios
Mark Twain is often credited with saying that history doesn’t repeat itself, but it often rhymes. Stories about a new technology that seems to be a game changer for day-to-day life, stretched valuations for the beneficiaries of that technology, and excitement about IPOs that benefit from that trend might sound familiar. While that can certainly be said about today’s environment, it is a description of what was happening in 1999 and early 2000. While today’s Artificial Intelligence (AI) companies have better and more sustainable business models than the poster children for the dot.com boom and bust period, there are some interesting things going on below the surface of the stock market that are reminiscent of what happened in 2000. The comparison may offer useful lessons for portfolio construction today.
Most investors remember Nasdaq’s nearly 40% decline in calendar year 2000 as the internet boom unwound. While it was the worst-performing large cap index, it was indicative of a violent rotation out of growth stocks. According to the Callan Periodic Table of Returns, the S&P 500 Growth and Russell 2000 Growth Indexes both declined 20%. But the rest of the market was made up of companies that weren’t direct beneficiaries of the internet and were trading at relatively attractive valuations. They also had established businesses that tended to produce earnings and cash flow. The Russell 2000 Value Index rallied over 20%, while the S&P Value Index rose 6% for the year. Per the Lehman Brothers Aggregate Bond Index (now known as the Bloomberg Aggregate Bond Index) bonds also put up double-digit returns. In one of the toughest market environments, there were still ways to add value to portfolios.
Market pullbacks inevitably raise concerns, and investors face risks beyond developments in the Middle East and monetary policy. These include the AI evolution and the upcoming midterm elections. However, the underlying fundamentals remain in solid shape. Recent weakness has been concentrated in a handful of high-profile growth stocks, creating a greater drag on capitalization-weighted indexes than on the broader market. As a result, while Nasdaq is down 8% over the past month, the equal-weighted S&P 500 has appreciated during that time. That is an encouraging sign for diversified portfolios, in our view.
Important Disclosures
This material is for general information only and is not intended to provide specific advice or recommendations for any individual. There is no assurance that the views or strategies discussed are suitable for all investors. To determine which investment(s) may be appropriate for you, please consult your financial professional prior to investing.
Investing involves risks including possible loss of principal. No investment strategy or risk management technique can guarantee return or eliminate risk.
Indexes are unmanaged and cannot be invested into directly. Index performance is not indicative of the performance of any investment and does not reflect fees, expenses, or sales charges. All performance referenced is historical and is no guarantee of future results.
This material was prepared by LPL Financial, LLC. All information is believed to be from reliable sources; however LPL Financial makes no representation as to its completeness or accuracy.
Unless otherwise stated LPL Financial and the third party persons and firms mentioned are not affiliates of each other and make no representation with respect to each other. Any company names noted herein are for educational purposes only and not an indication of trading intent or a solicitation of their products or services.
Asset Class Disclosures –
International investing involves special risks such as currency fluctuation and political instability and may not be suitable for all investors. These risks are often heightened for investments in emerging markets.
Bonds are subject to market and interest rate risk if sold prior to maturity.
Municipal bonds are subject and market and interest rate risk and potentially capital gains tax if sold prior to maturity. Interest income may be subject to the alternative minimum tax. Municipal bonds are federally tax-free but other state and local taxes may apply.
Preferred stock dividends are paid at the discretion of the issuing company. Preferred stocks are subject to interest rate and credit risk. They may be subject to a call features.
Alternative investments may not be suitable for all investors and involve special risks such as leveraging the investment, potential adverse market forces, regulatory changes and potentially illiquidity. The strategies employed in the management of alternative investments may accelerate the velocity of potential losses.
Mortgage backed securities are subject to credit, default, prepayment, extension, market and interest rate risk.
High yield/junk bonds (grade BB or below) are below investment grade securities, and are subject to higher interest rate, credit, and liquidity risks than those graded BBB and above. They generally should be part of a diversified portfolio for sophisticated investors.
Precious metal investing involves greater fluctuation and potential for losses.
The fast price swings of commodities will result in significant volatility in an investor’s holdings.
This research material has been prepared by LPL Financial LLC.
Not Insured by FDIC/NCUA or Any Other Government Agency | Not Bank/Credit Union Deposits or Obligations | Not Bank/Credit Union Guaranteed | May Lose Value
For Public Use – Tracking: #1148883