The bear market that started on June 13 has left the S&P 500 Index 23.5% below its January 3 high. After the initial positive reaction to the Federal Reserve’s first 0.75% rate hike since 1994 and tough talk on inflation, heightened fears of recession and that the Fed might “break something” sent stocks down for the 10th week out of 11 for only the second time in history (The first was in 1970). To help investors manage through this difficult period, we answer some of the top questions we’re getting about bear markets and list some things to watch to assess progress toward an eventual durable low.
How long do bear markets typically last?
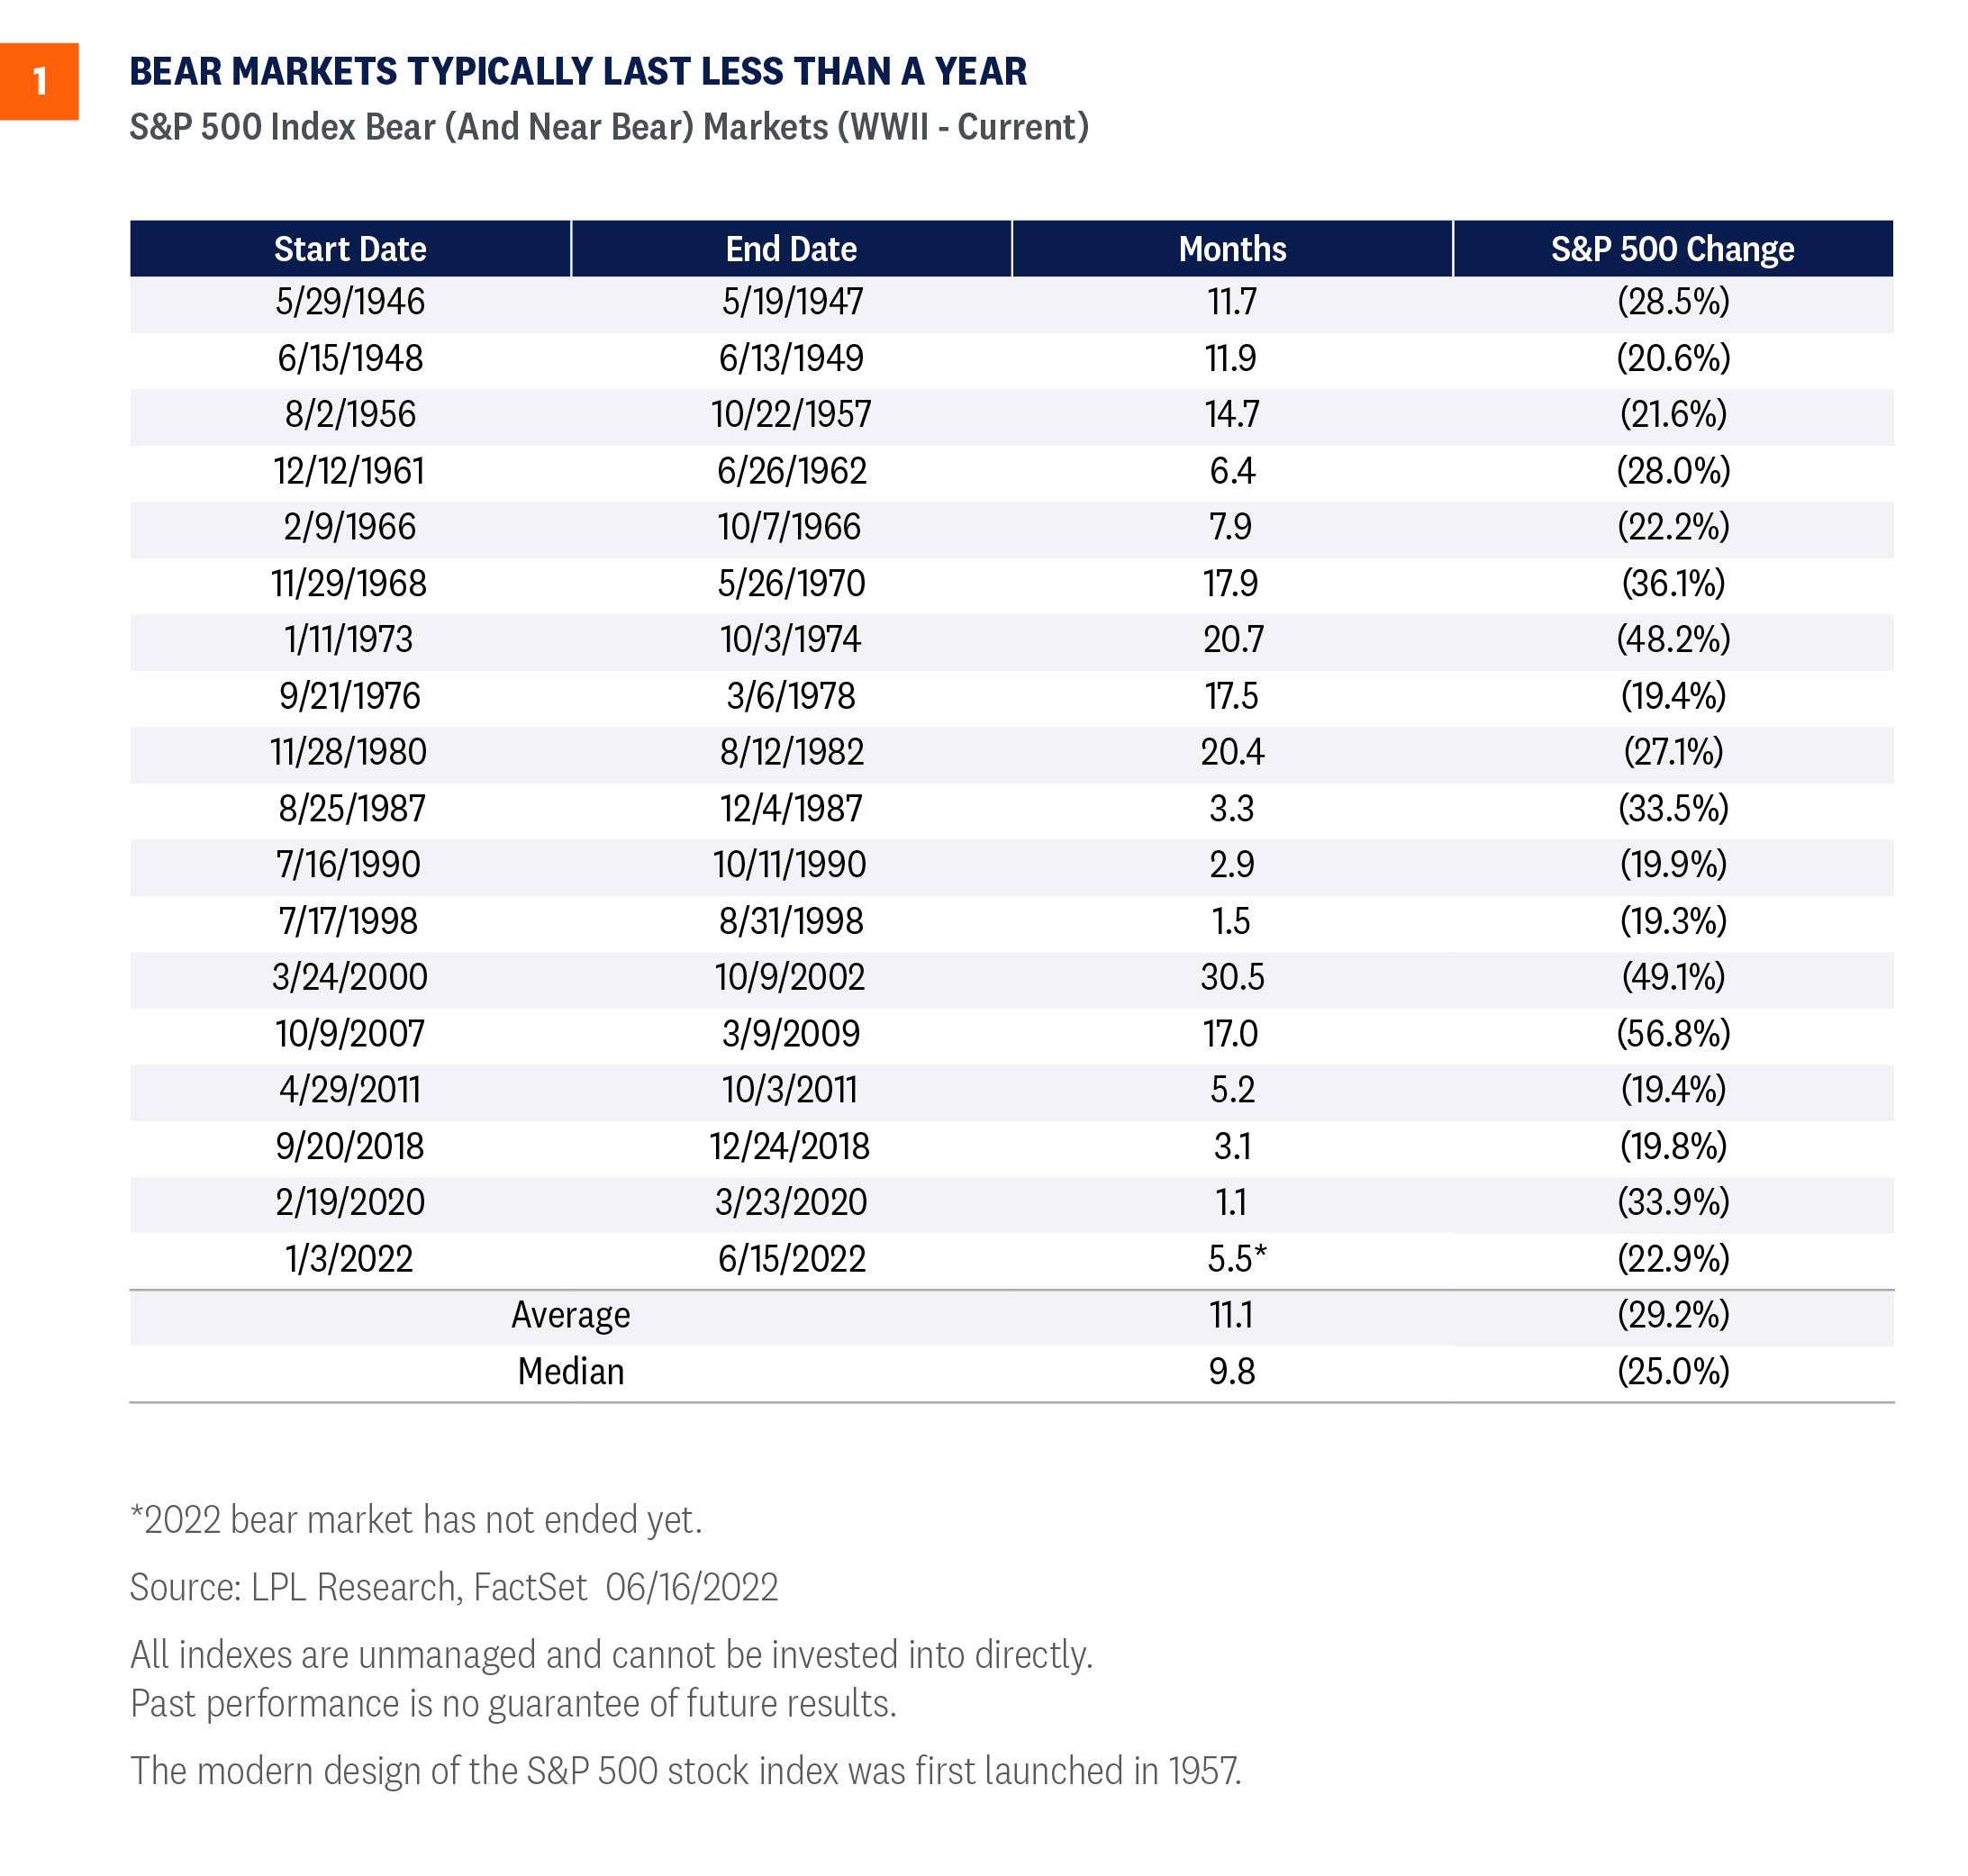
The current bear market, which began at the January 2022 highs for the S&P 500 Index, is actually already old by recent standards. At about five-and-a-half months old, it is already older than six other bear markets going back nearly 40 years, with only the 2000-2002 tech bubble and 2008-2009 financial crisis bears lasting longer. This means the bear market may be closer to a bottom than many expect. The average bear market since 1950 has taken about 11 months to mark its low, but six out of the last eight bear markets ended within six months [Figure 1].
How this bear market will end will likely hinge on the pace at which inflation comes down, which will dictate the timing and magnitude of the Federal Reserve’s (Fed) rate hiking campaign. How fast the Fed moves will determine how much the economy slows and whether something breaks (like a large financial institution going under, though that’s not our expectation). If a full-blown crisis and recession such as in 2000-2002 and 2008-09 can be avoided, this bear market may bottom soon.
How much further might stocks fall?
The average bear market since 1950 has seen the S&P 500 lose an average of about 29% (including the near bear markets that saw declines of 19-20%), as shown in Figure 1. That suggests that if this bear market ends up around the average, that stocks may drop another 5% or so. Based on current economic conditions, one could make the case that this bear market could be shallower than typical bears because consumer balance sheets and the job market are still in good shape, and interest rates are still low by historical standards. At the same time, however, the inflation problem won’t be solved quickly, suggesting we could see a slow bleed and end up down near the average of 30%.
Looking back at bear markets throughout history, a key determining factor of where the declines ended has been whether the U.S. economy goes into recession. With a recession, bear market declines have averaged 35%. Without, they’ve averaged 24%, close to where the S&P 500 is now. LPL Research puts roughly 50% odds of recession in the next 12 to 18 months, and sees a mild recession if we get one, while the market has already priced in about a 70% chance of recession. As a result, the LPL Research Strategic and Tactical Asset Allocation Committee remains comfortable with 62% equities for the typical 60/40 portfolio and is considering adding to equities on weakness.
How does the bull market that just ended compare to history?
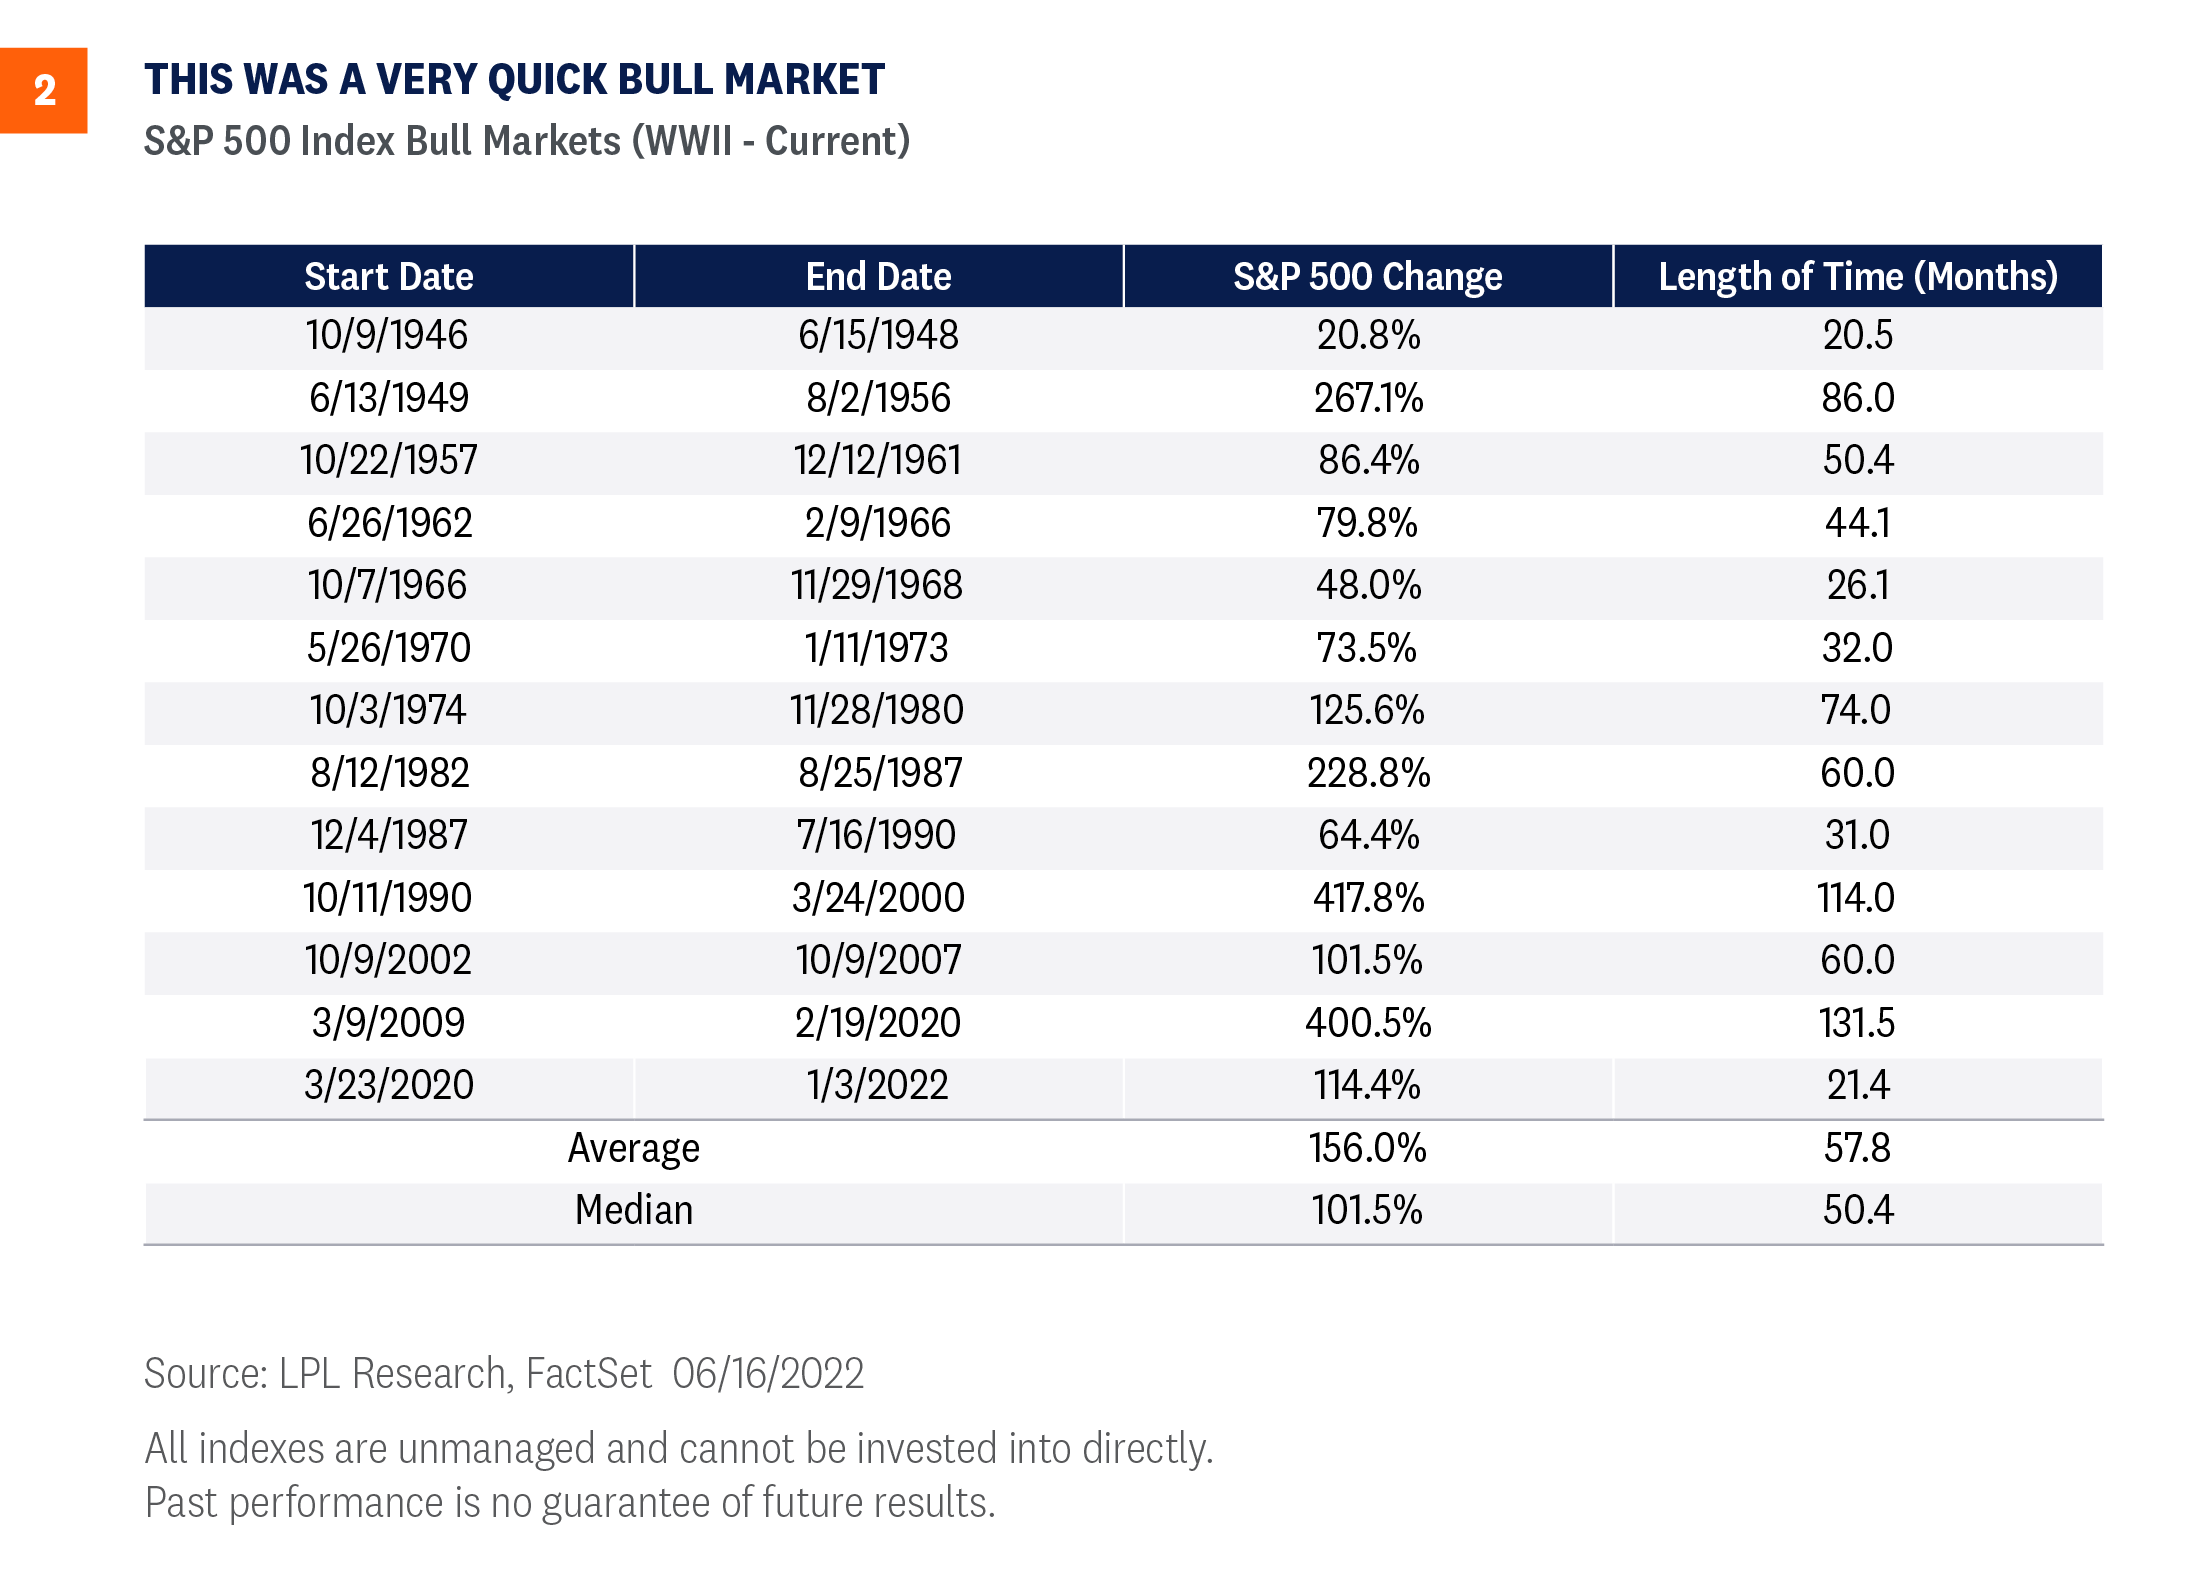
This bull market that just ended last week was short but powerful. It lasted only 21 months from the March 2020 lows through the January 2022 peak, checking in as the shortest bull market since WWII [Figure 2]. However, this bull was also the quickest to ever double, achieving that feat in just five months on August 16, 2020.
While the losses experienced this year are painful, some perspective on where we came from may be helpful. Off the pandemic lows in March 2020, the S&P 500 rose 114% in less than two years before pulling back 23-24%. The index is still up 64% off its pandemic lows after this year’s decline, with a total return of 70% including dividends.
How have stocks historically done after entering bear markets?
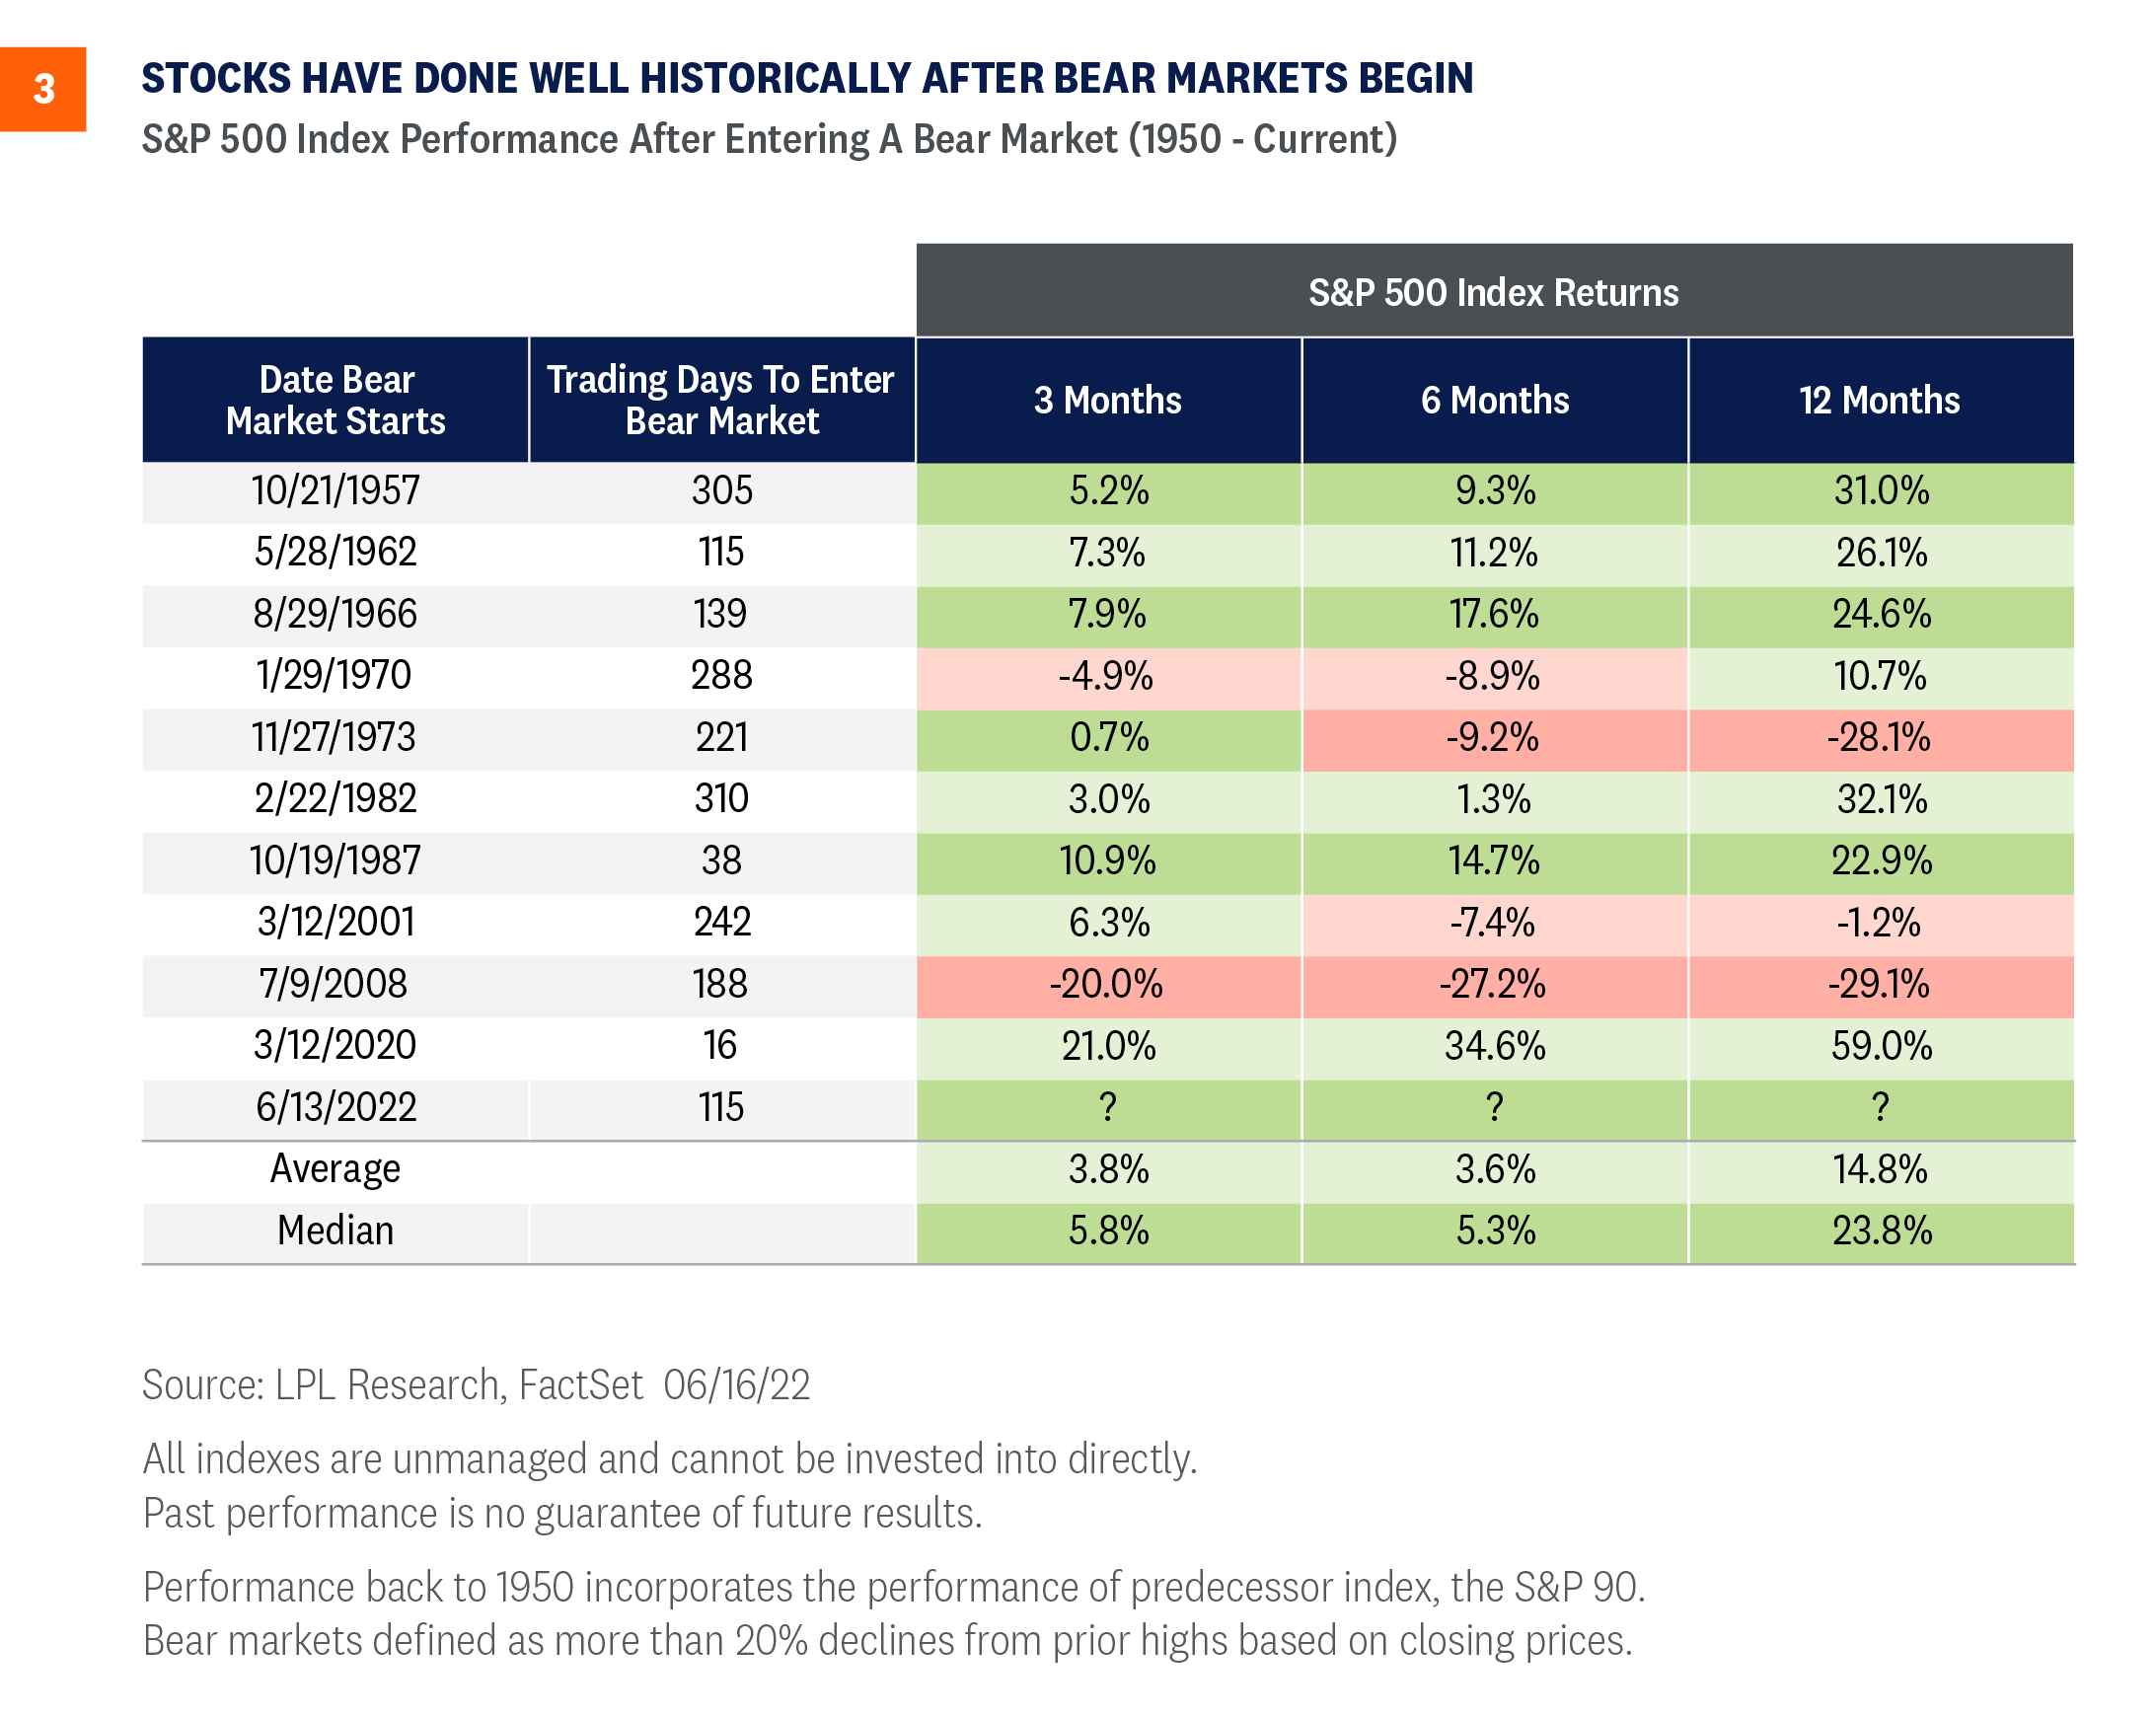
After the S&P 500 has entered a bear market, stocks have historically done pretty well, up an average of nearly 15% a year later with an even better median gain of 23.8% [Figure 3]. Those gains would be much better if not for the 1973-74 recession, the dotcom bust in 2000, and the 2008-09 financial crisis. An economy like any of these over the next year is very unlikely in our view, so we believe the likelihood that stocks are much higher a year from now is high. That doesn’t mean stocks can’t go down further in the short term, and forming a bottom could easily take a good chunk of the summer (any longer than that would surprise us). But for long-term investors, especially those who have invested relatively conservatively, it means an attractive opportunity may be developing.
How long does it typically take to recover bear market losses?
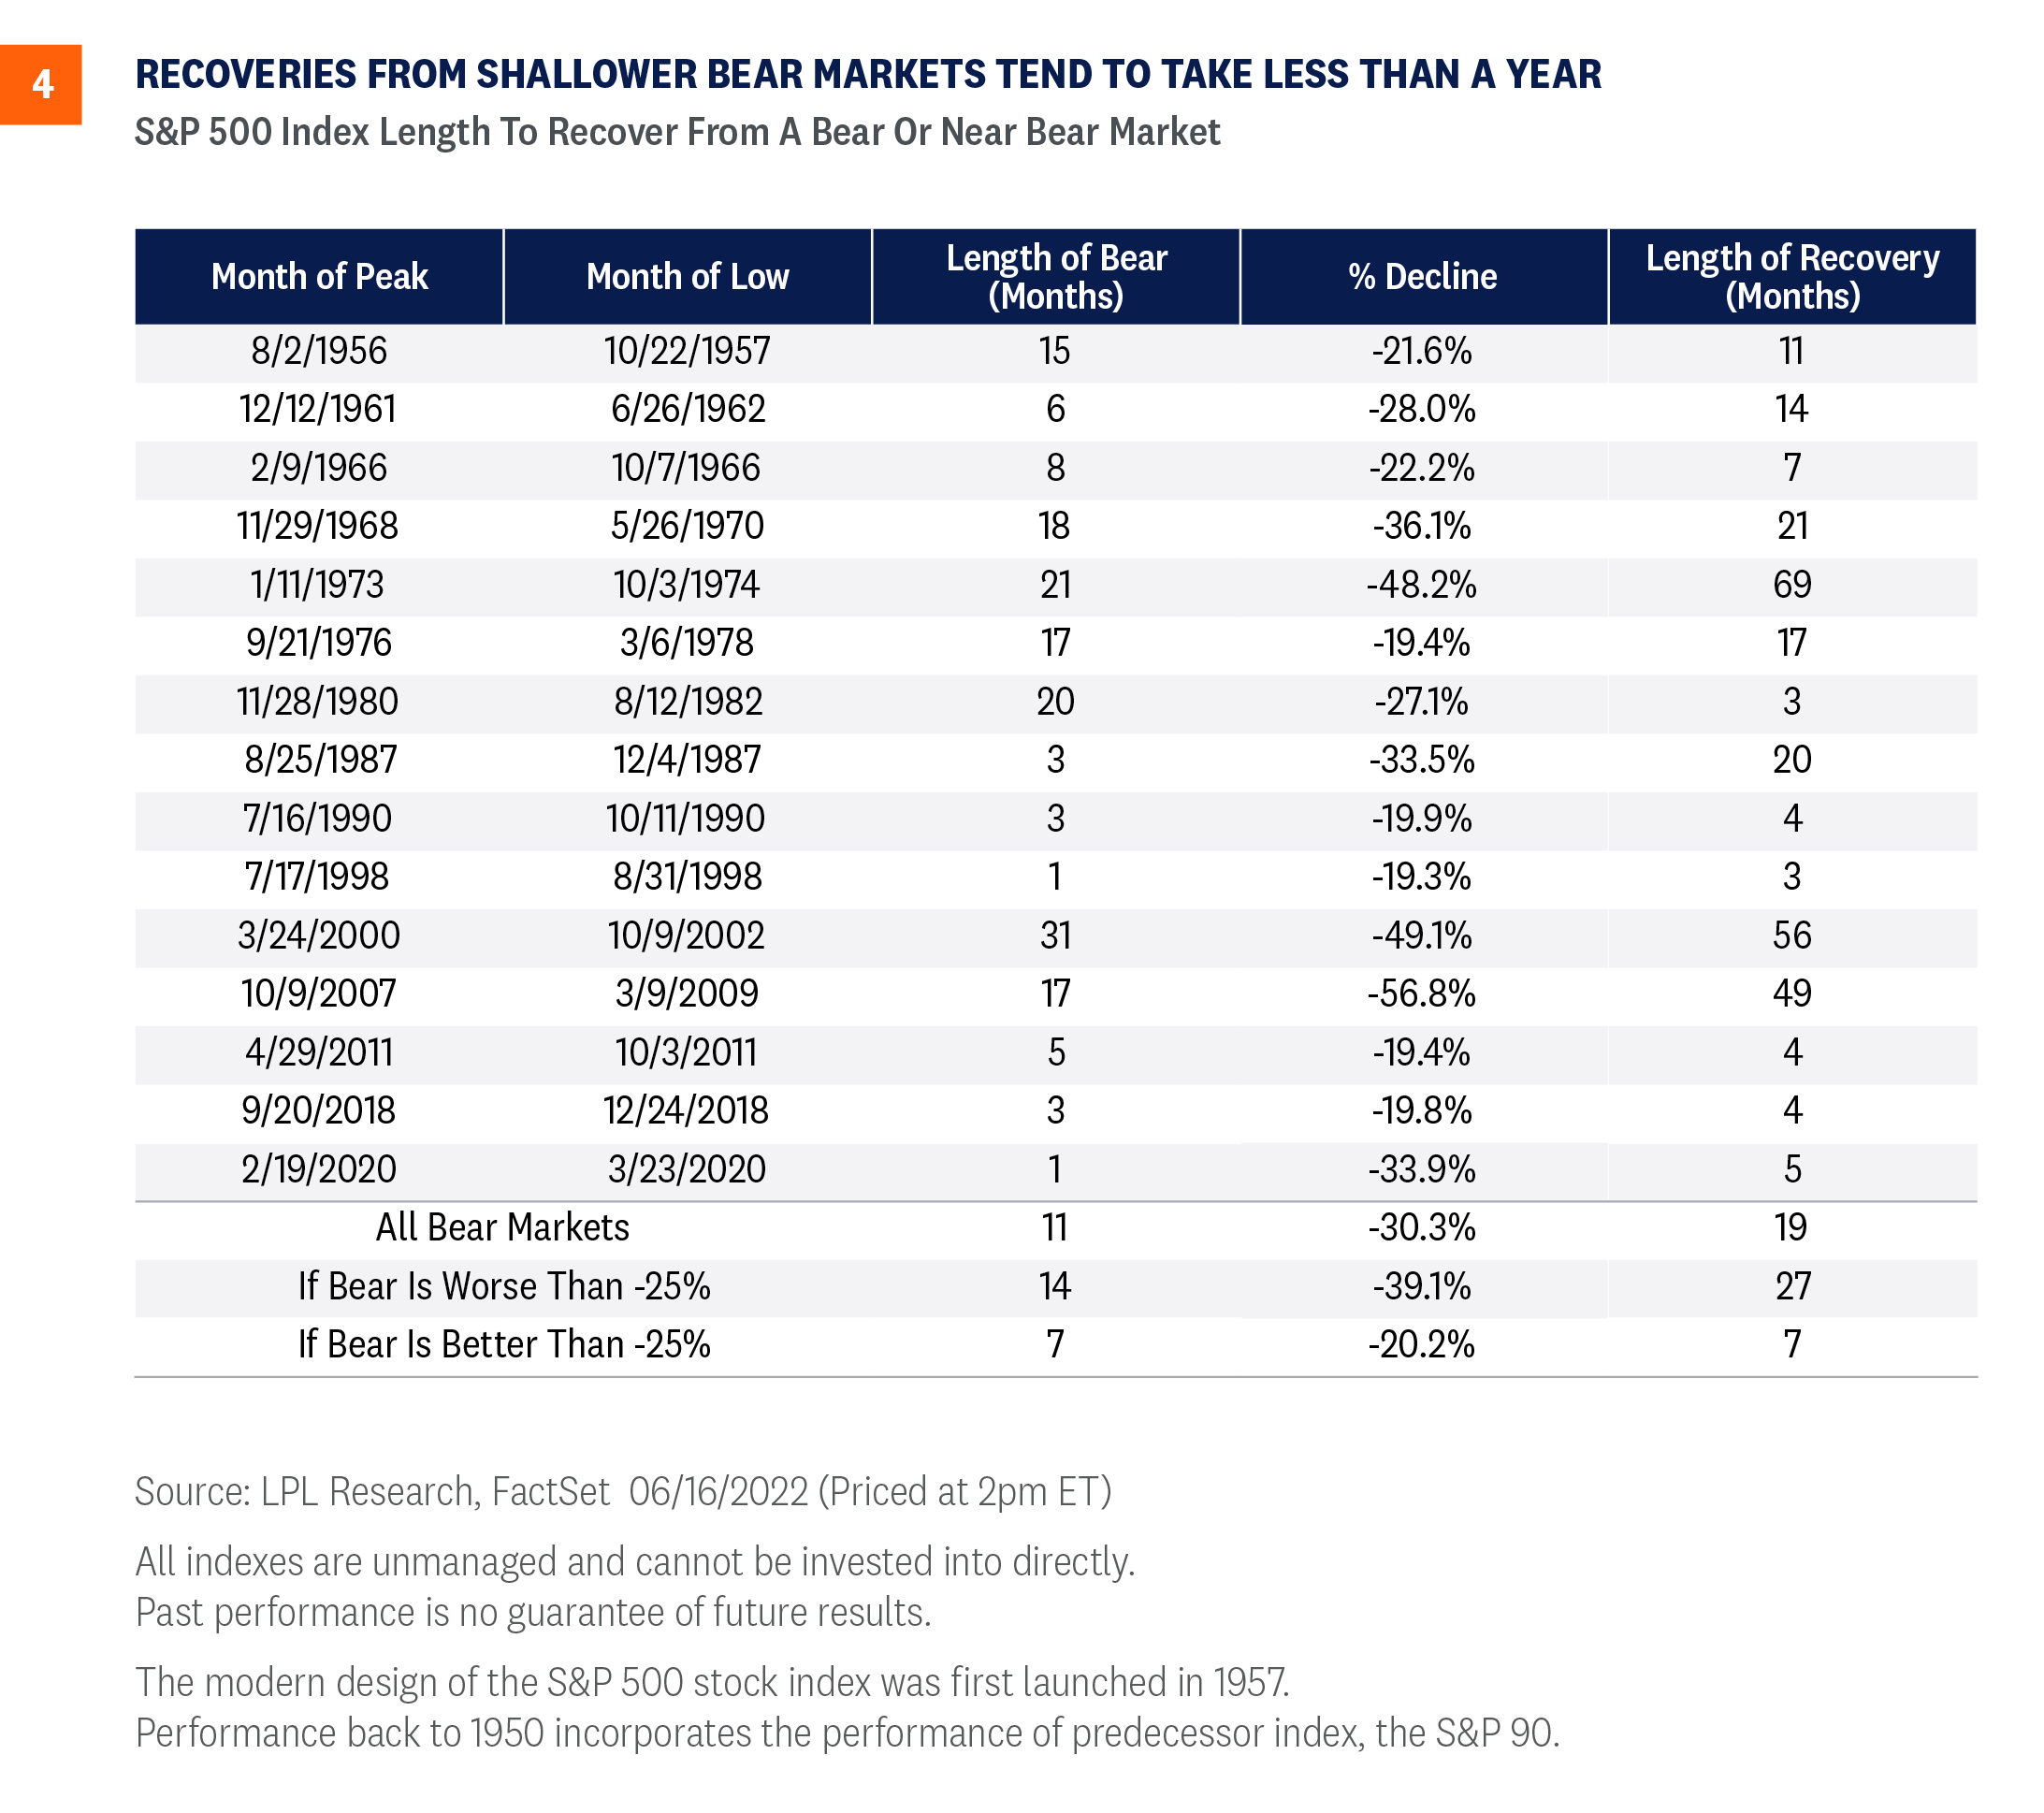
Stocks have staged some quick recoveries from bear market lows in the past. The average bear market takes about 19 months to get back all of its losses, but shallower bears—those when the S&P 500 falls less than 25%— bounce back faster. As shown in Figure 4, recoveries from bear markets that are down less than 25% take an average of just seven months to recover, while those down more than 25% (for an average decline of 39.1%) take 27 months, or over two years on average, to get back to the prior highs. Lastly, stocks have recently recovered much more quickly, at only four and five months to recover losses from the last three bear markets.
We think this bear market has more in common with the less severe bear markets and therefore believe it’s reasonable to suggest this bear market may be erased in less than a year.
Are valuations low enough to help stocks find a floor?
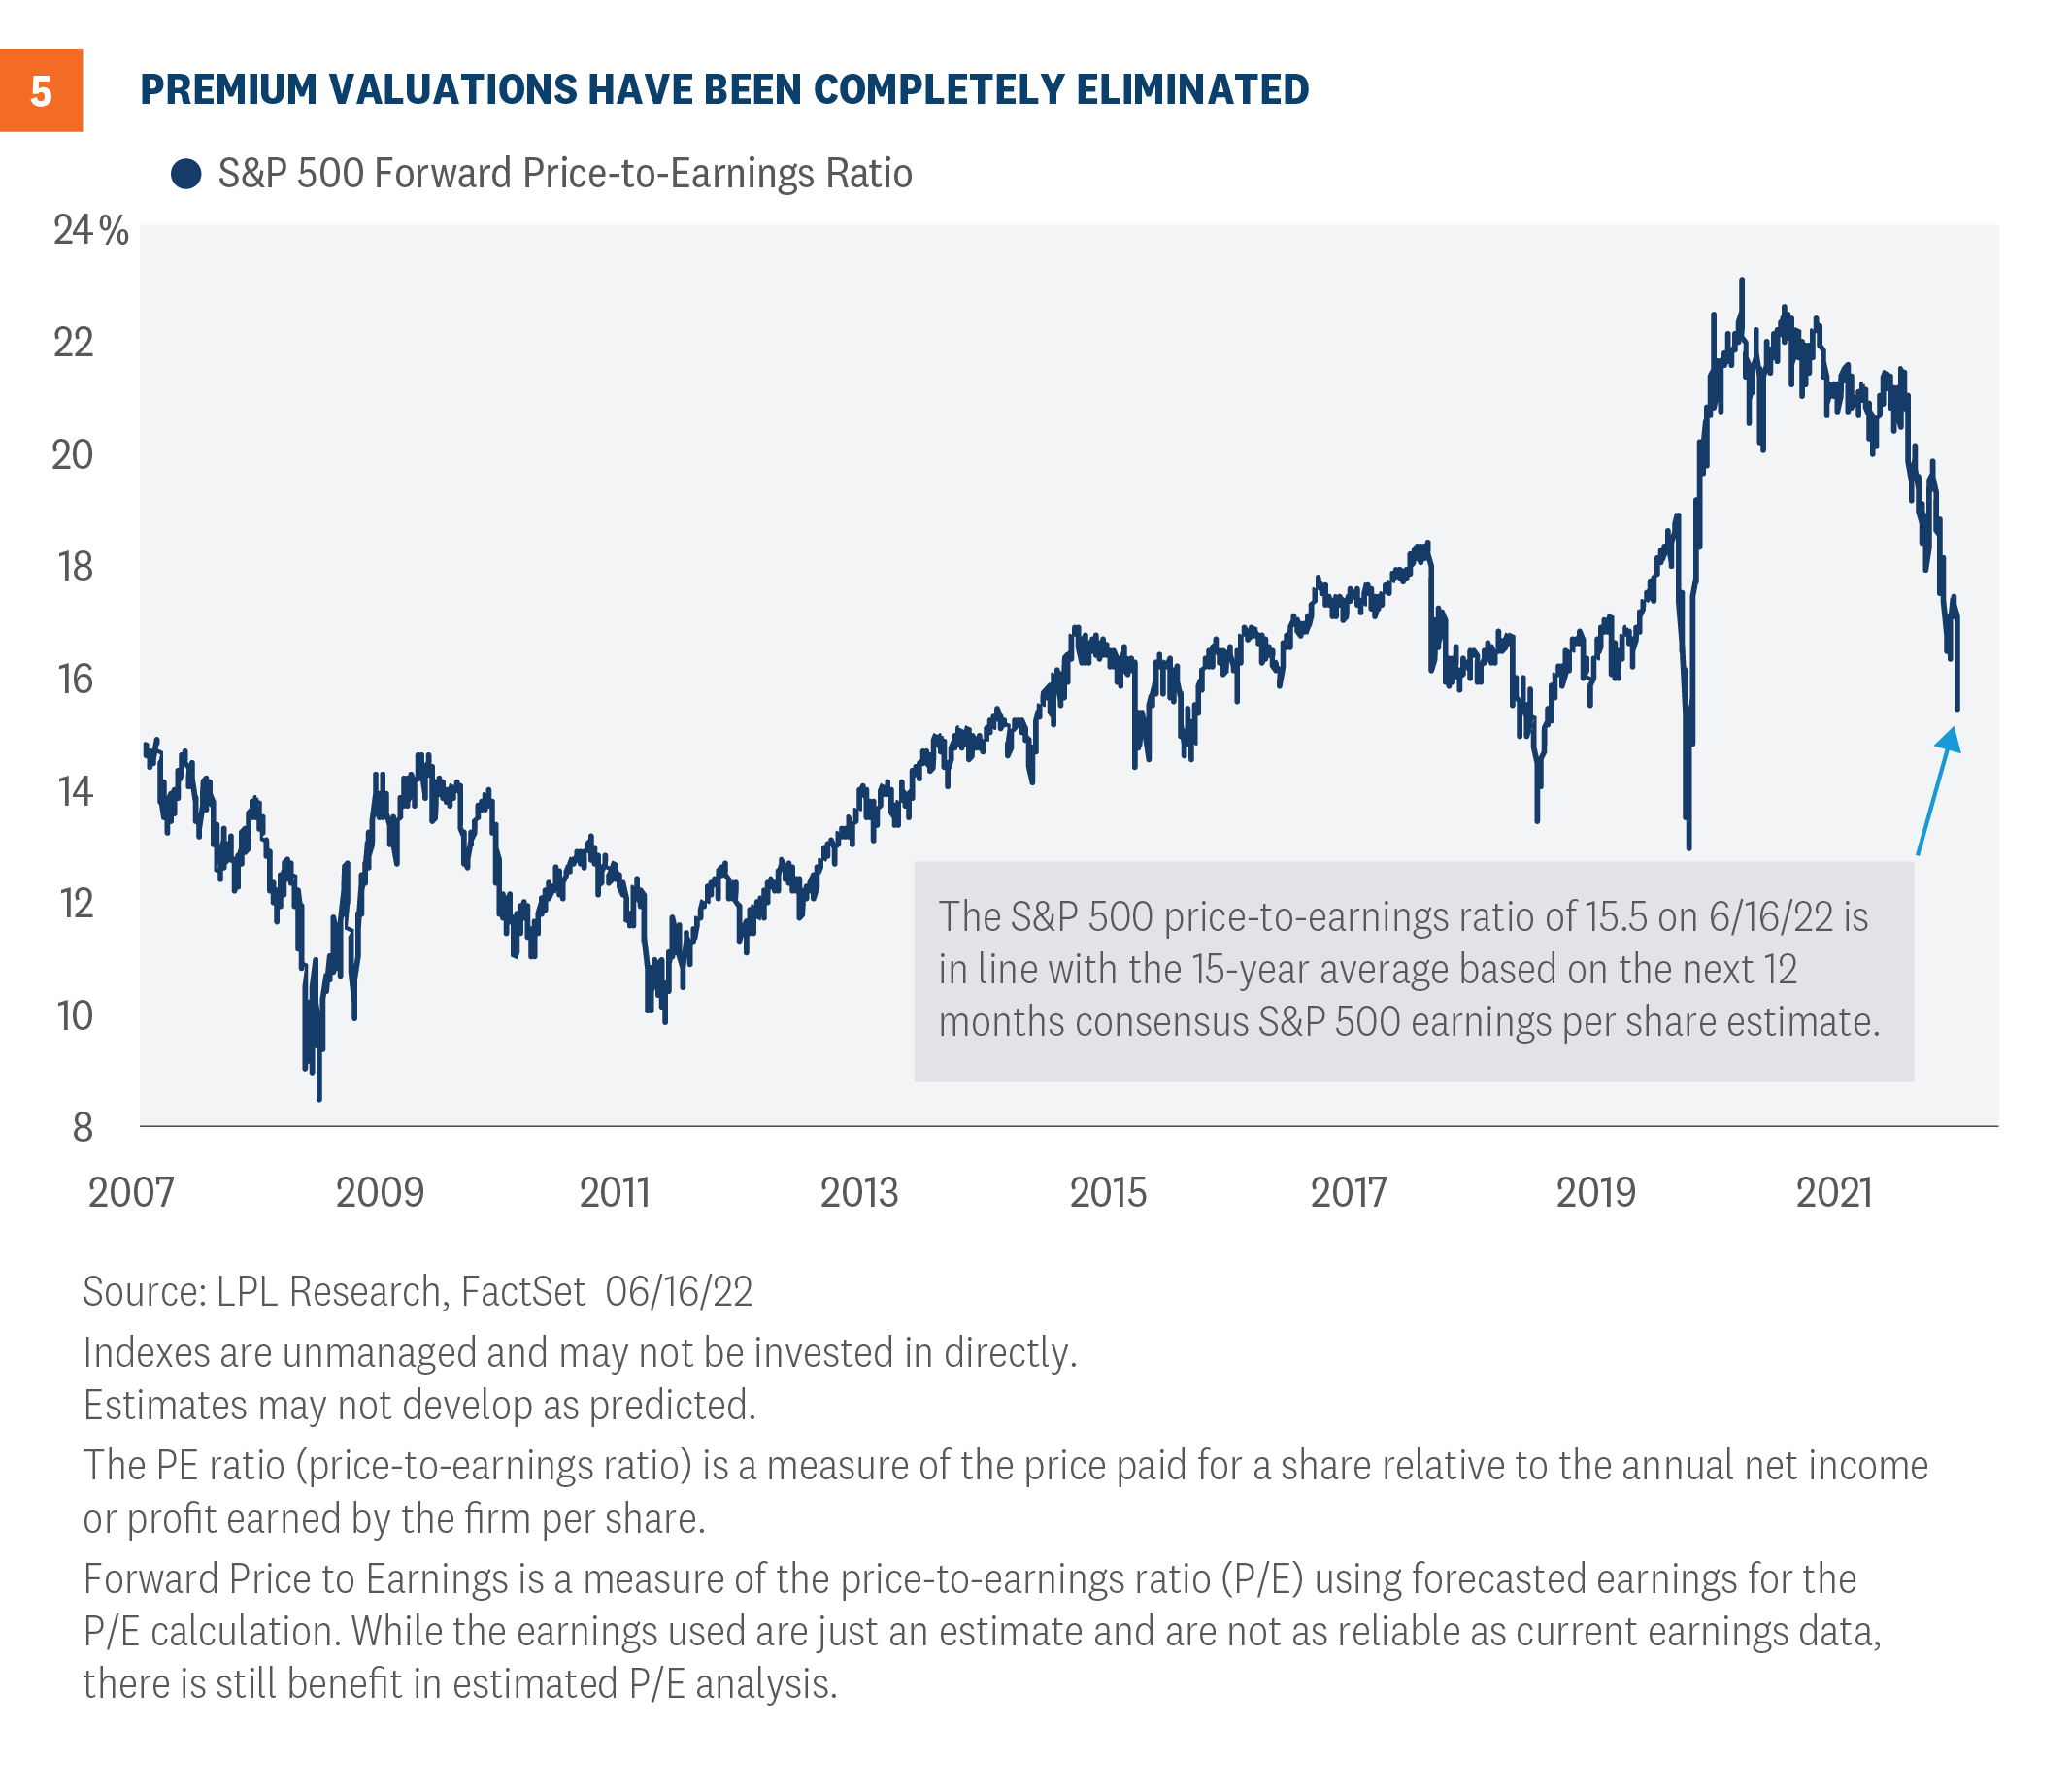
The simple answer here is it depends. With the S&P 500 at a price-to-earnings ratio (P/E) of 15.5 based on the consensus S&P 500 earnings per share (EPS) estimate for the next 12 months, valuations for U.S. large cap stocks are only slightly below the 30-year average [Figure 5]. Reasonable beats expensive, but historically bear market lows have been accompanied by P/Es below 15.
However, if we move down the market cap spectrum, we find the S&P 600 Index of small cap stocks trading at 11 times next 12 months EPS, well below its long-term average of 16.5. International markets, which have suffered almost as much as U.S. stocks, enjoy attractive valuations at P/Es of 11-12 for developed and emerging markets, based on the MSCI indexes.
Looking at valuations another way, relative to Treasury yields, stocks are more attractively valued than historical averages. The equity risk premium (ERP, or the earnings yield minus the 10-year Treasury yield) is 2.5%, above the long-term average below one percent (earnings yield is simply the earnings-to-price ratio). A higher ERP means stock valuations are attractive relative to bonds despite higher interest rates.
What signals are you watching to suggest lows are in?
Stocks have been unable to stage even the most modest of bear market rallies in recent months, despite extreme oversold conditions. We believe that technical damage of this magnitude is likely to take time to repair and that the chances of “V-shaped recovery” so common in the era of quantitative easing are much less likely than in recent history.
Some of the quantitative metrics we are using to help assess the bottoming process include more extreme levels of the VIX (implied volatility index) followed by falling volatility as stocks decline, hedging activity in the options markets, percentages of advancing trading volume versus declining, and extreme breadth of stocks trading below long-term moving averages.
Conclusion
We don’t know where this bear market will end, but we believe we’re getting close. Consumers and businesses faced more severe challenges in some of the worst bear markets of the modern era such as 2000-2002 and 2008-2009, so we would be very surprised if this bear market came anywhere near the magnitudes of those declines. At the same time, we have not seen the indiscriminate selling that we’ve seen at other major lows to call a bottom right here.
While the Fed made transitory a bad word for the markets, we remain confident that inflation will soon start to improve and continue to get better through year-end and 2023. Once the markets are convinced of that, stocks could turn around. While a positive year for stocks is a lot to ask at this point, we believe the amount of pessimism reflected in stock prices today is highly likely to diminish over the back half of the year, and that is a formula for a potential nice comeback.
Click here to download a PDF of this report.
IMPORTANT DISCLOSURES
This material is for general information only and is not intended to provide specific advice or recommendations for any individual. There is no assurance that the views or strategies discussed are suitable for all investors or will yield positive outcomes. Investing involves risks including possible loss of principal. Any economic forecasts set forth may not develop as predicted and are subject to change.
References to markets, asset classes, and sectors are generally regarding the corresponding market index. Indexes are unmanaged statistical composites and cannot be invested into directly. Index performance is not indicative of the performance of any investment and does not reflect fees, expenses, or sales charges. All performance referenced is historical and is no guarantee of future results.
Any company names noted herein are for educational purposes only and not an indication of trading intent or a solicitation of their products or services. LPL Financial doesn’t provide research on individual equities.
All information is believed to be from reliable sources; however, LPL Financial makes no representation as to its completeness or accuracy.
U.S. Treasuries may be considered “safe haven” investments but do carry some degree of risk including interest rate, credit, and market risk. Bonds are subject to market and interest rate risk if sold prior to maturity. Bond values will decline as interest rates rise and bonds are subject to availability and change in price.
The Standard & Poor’s 500 Index (S&P500) is a capitalization-weighted index of 500 stocks designed to measure performance of the broad domestic economy through changes in the aggregate market value of 500 stocks representing all major industries.
The PE ratio (price-to-earnings ratio) is a measure of the price paid for a share relative to the annual net income or profit earned by the firm per share. It is a financial ratio used for valuation: a higher PE ratio means that investors are paying more for each unit of net income, so the stock is more expensive compared to one with lower PE ratio.
Earnings per share (EPS) is the portion of a company’s profit allocated to each outstanding share of common stock. EPS serves as an indicator of a company’s profitability. Earnings per share is generally considered to be the single most important variable in determining a share’s price. It is also a major component used to calculate the price-to-earnings valuation ratio.
Forward Price to Earnings is a measure of the price-to-earnings ratio (P/E) using forecasted earnings for the P/E calculation. While the earnings used are just an estimate and are not as reliable as current earnings data, there is still benefit in estimated P/E analysis. The forecasted earnings used in the formula can either be for the next 12 months or for the next full-year fiscal period.
All index data from FactSet.
This research material has been prepared by LPL Financial LLC.
Securities and advisory services offered through LPL Financial (LPL), a registered inv estment advisor and broker -dealer (member FINRA/SIPC). Insurance products are offered through LPL or its licensed affiliates. To the extent you are receiving investment a dvice from a separately registered independent investment advisor that is not an LPL affiliate, please note LPL makes no representation with respect to such entity.
| Not Insured by FDIC/NCUA or Any Other Government Agency | Not Bank/Credit Union Guaranteed | Not Bank/Credit Union Deposits or Obligations | May Lose Value |
RES-1190200-0622 | For Public Use | Tracking # 1-05295559 (Exp. 06/23)