Earnings growth of 6-7% doesn’t sound very exciting, but given the challenges corporate America has faced, we consider the nearly-complete second quarter earnings season a resounding success. The numerous challenges last quarter included a slowing economy, intensifying inflation pressures, ongoing global supply chain disruptions, and a surging U.S. dollar. Still, corporate America delivered the type of upside investors have grown accustomed to in much easier economic environments.
The numbers
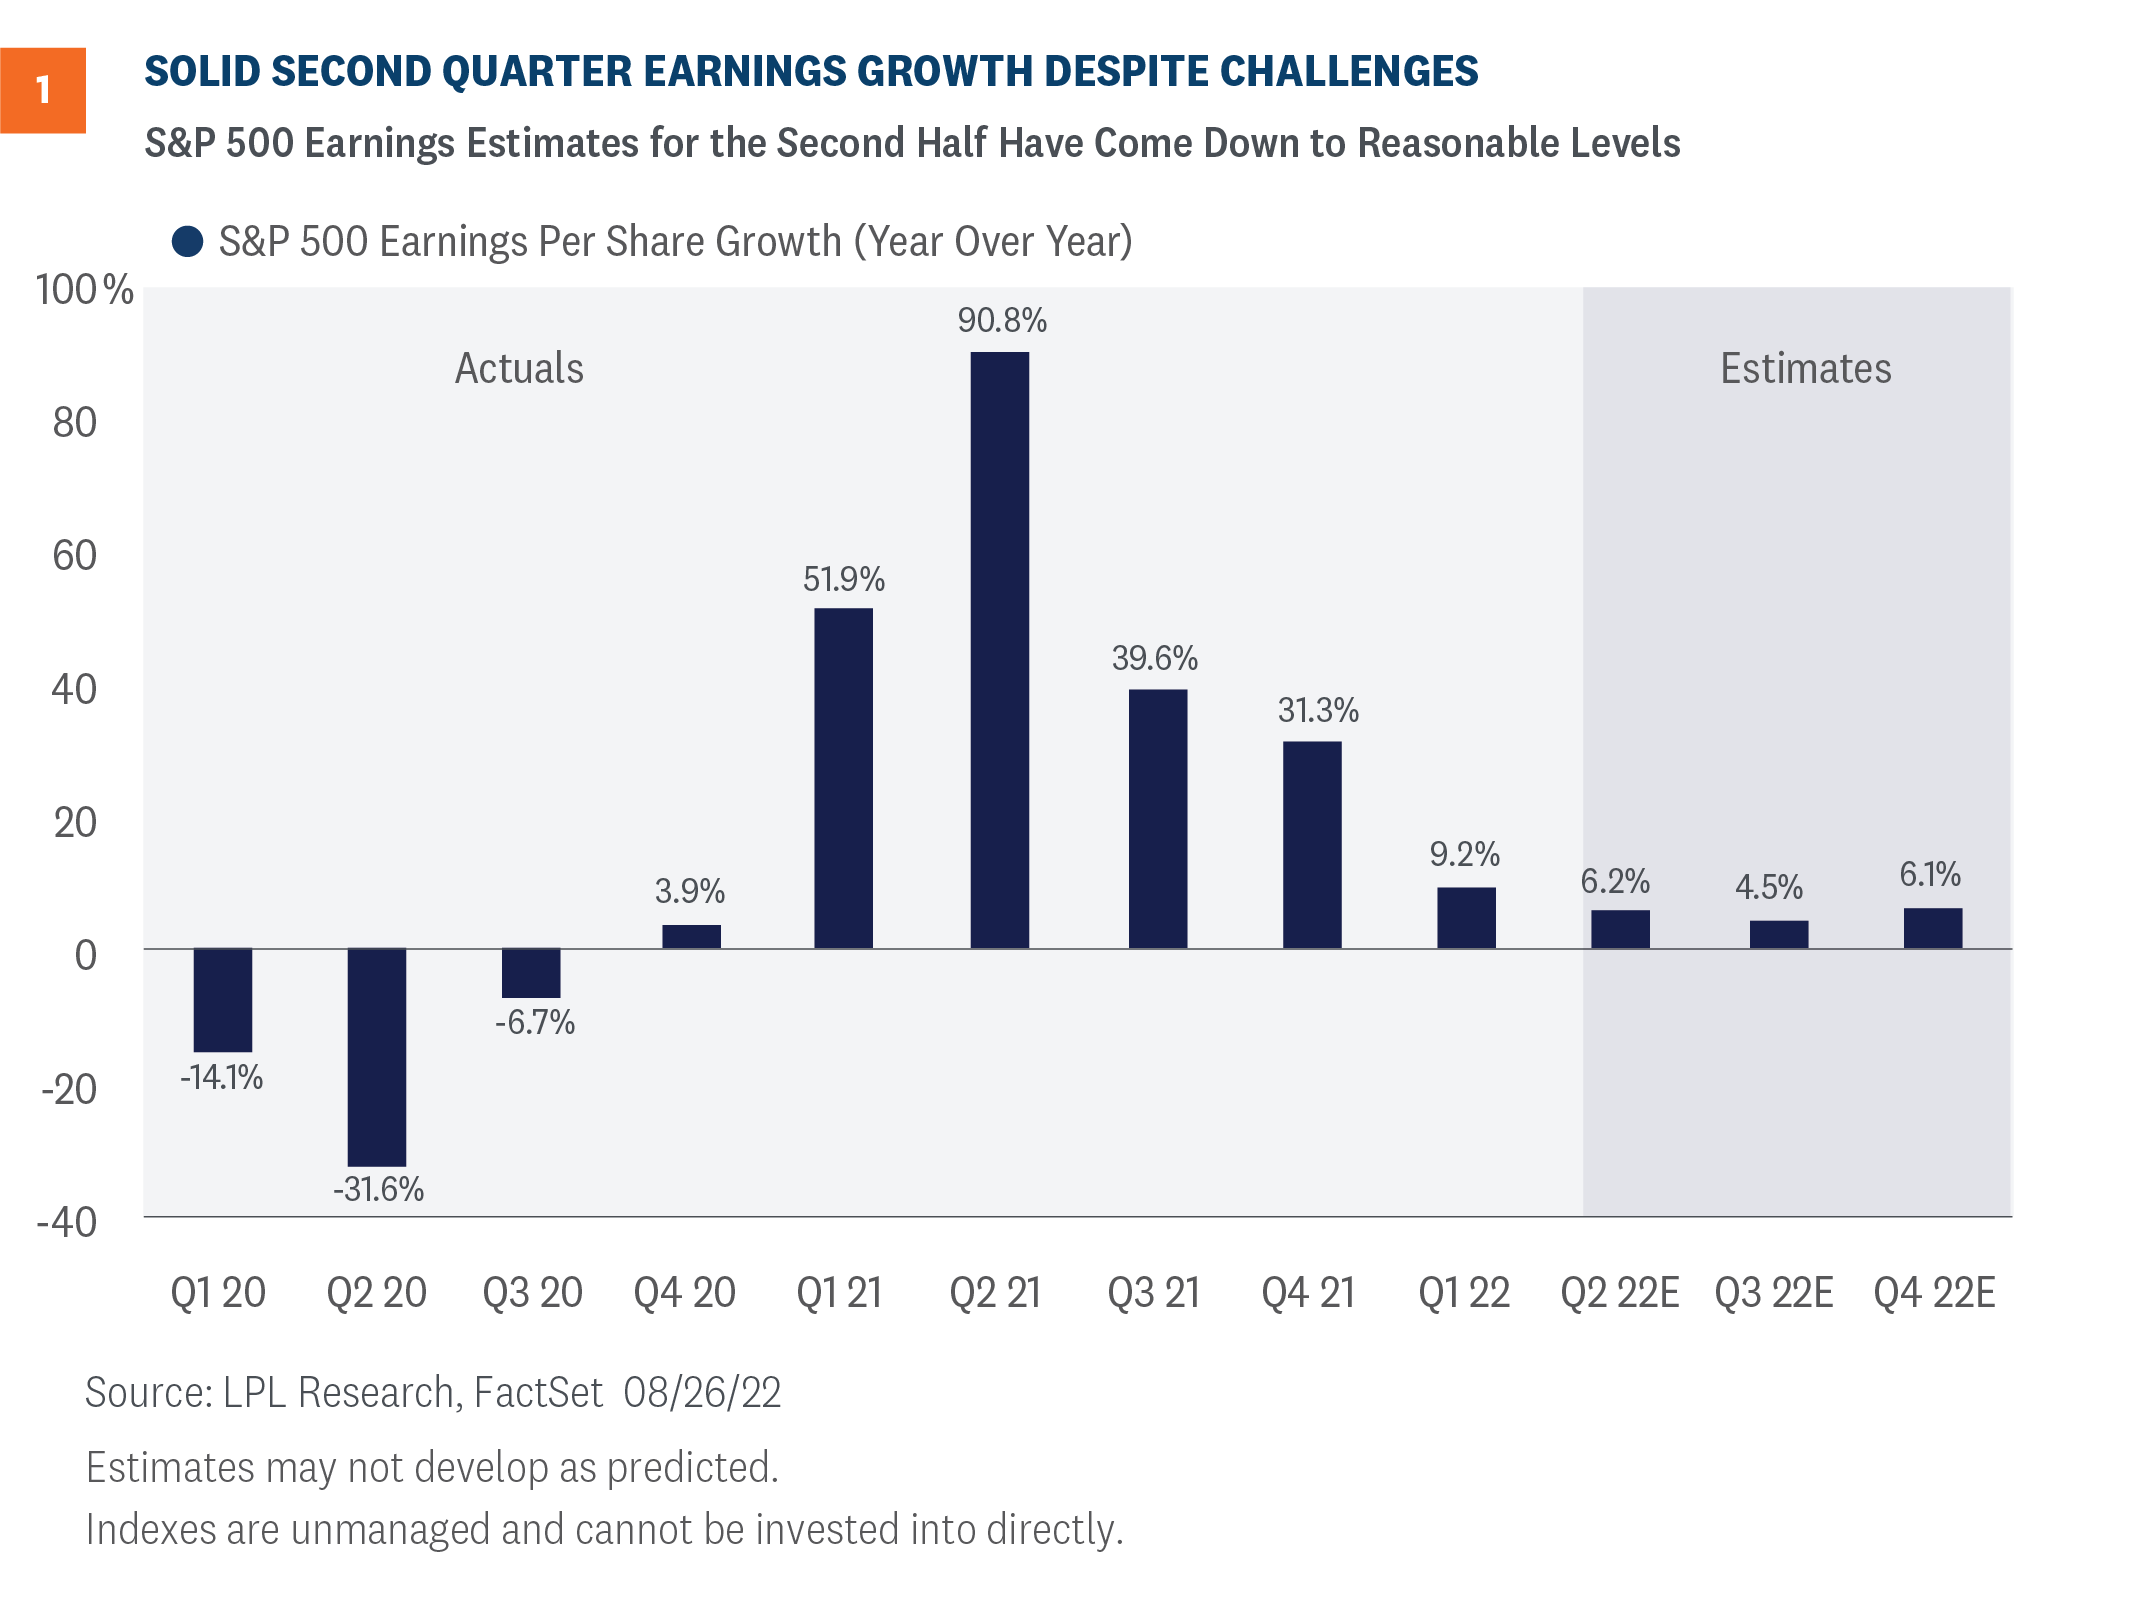
We anticipated more modest upside to estimates in the second quarter and that’s what we got. Some of the key numbers include:
- Estimates for S&P 500 earnings per share (EPS) growth coming into reporting season were around 4.1%. That number looks like it will end up at around 6.2%, according to FactSet estimates [Figure 1].
- Revenue grew a very solid 14% year-over-year, well above the roughly 10% expected when earnings season began.
- A solid 76% and 71% of S&P 500 companies beat their earnings and revenue targets, similar to five-year averages.
- Energy delivered the fastest earnings growth among sectors, nearly quadrupling profits from the year-ago quarter. The sector also posted the second biggest upside surprise among all sectors at 9 percentage points, trailing only utilities.
Focus on profit margins
In our last Equity Strategy Insights publication, we highlighted profit margins as one of the key factors to watch during reporting season. We had posited that published estimates for profit margins were too high but that they were unlikely to come down significantly. Estimated profit margins for the second half of 2022 did indeed come down as companies reported, but not dramatically so.
Strong revenue growth in the mid-teens is one big reason why margins are holding up in this inflationary environment. That additional revenue, and the pricing power that helps produce it, provides companies with some margin cushion to help them reach their earnings targets.
Analysts’ estimates no longer reflect margin expansion in coming years. We know analysts’ estimates tend to be overly optimistic, but we still view expectations of stable margins as a positive sign for future profitability. That said, earnings targets will be very tough to reach in 2023 if high inflation lingers. The pace of improvement may be stubbornly slow despite some progress toward normalizing supply chains and loosening labor markets.
Estimates for this year look reasonable, 2023 have to come down
Coming into earnings season, the overwhelming view from Wall Street strategists was that earnings estimates had to come down substantially. The thought process for many was that earnings drop in a recession, so while 2022 profits may be near consensus estimates (our expectation), 2023 may see a profit decline. That would make our $235 estimate for S&P 500 EPS in 2023 overly optimistic and potentially put something like $200 in play (not our expectation).
Figure 2 shows how resilient 2022 earnings estimates have been. The consensus estimate for S&P 500 EPS for 2022 at $226 is still slightly above our $225 forecast. And despite coming down about $8 from its prior high, the consensus estimate for S&P 500 EPS in 2023 is still near $244, well above our $235 estimate despite mostly cautious guidance from corporate America and pretty dour sentiment from business leaders.
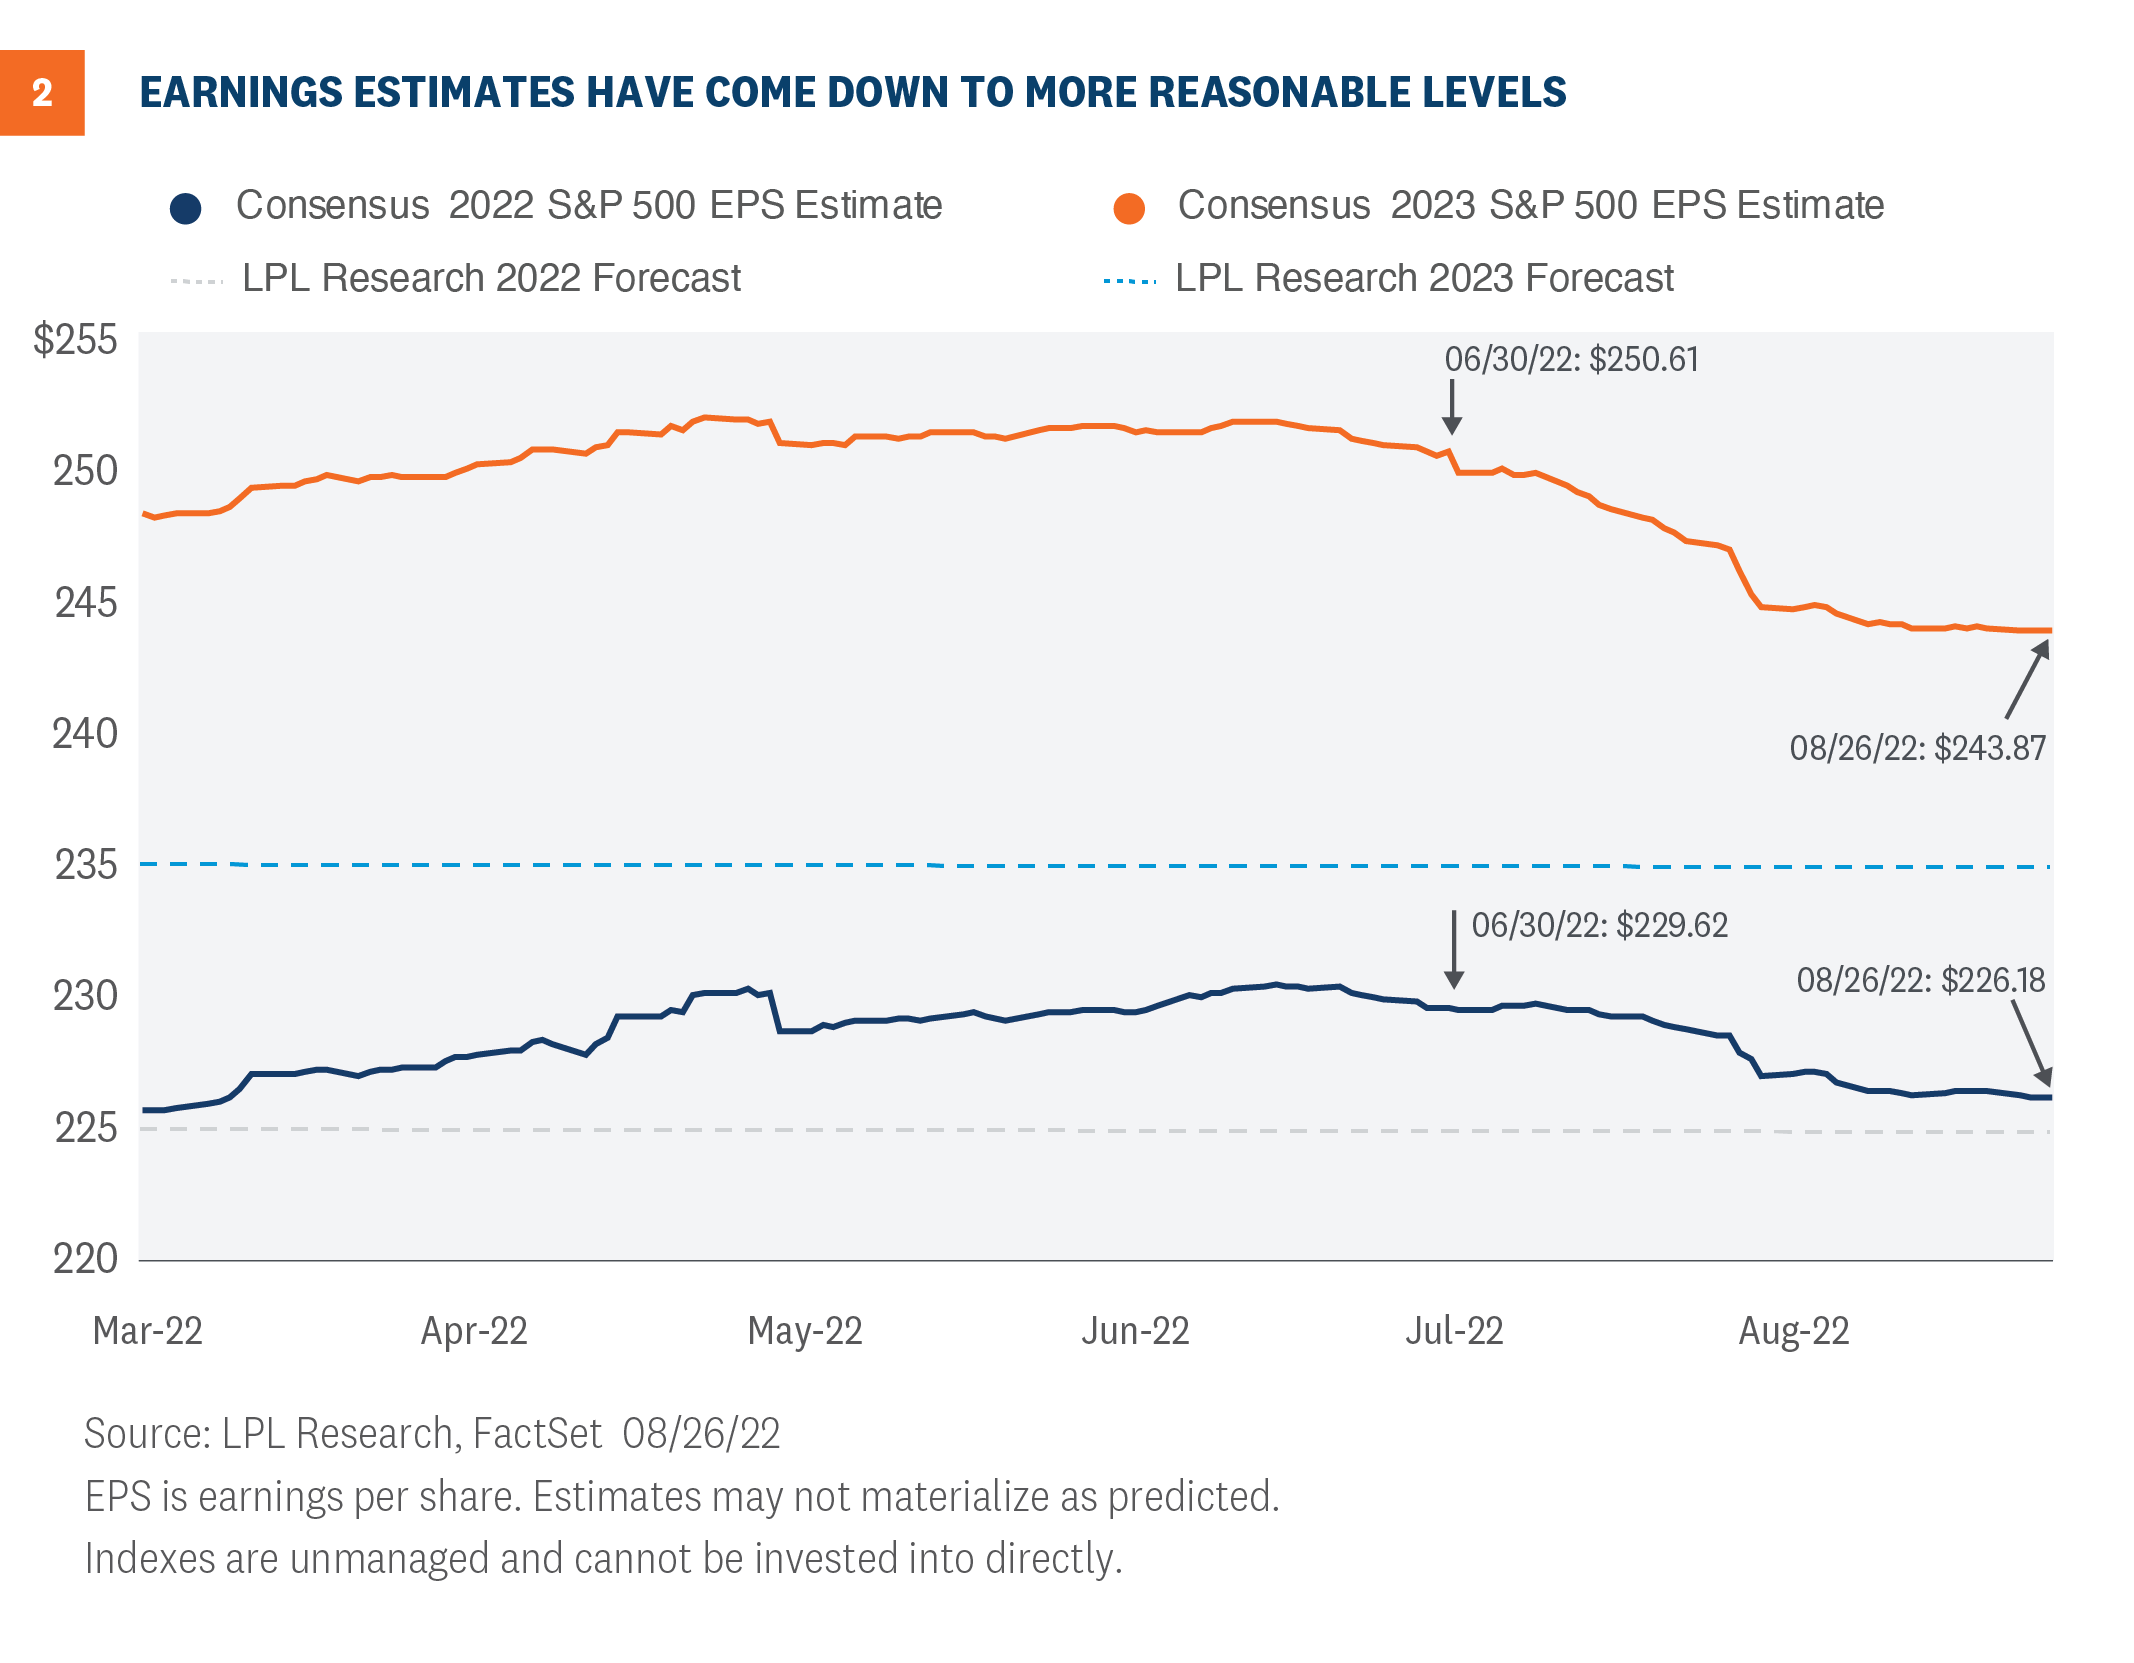
We still feel good about our $235 number for 2023 S&P 500 EPS, representing only a 4% increase over our 2022 estimate. We’re counting on inflation pressures easing next year while economic growth potentially picks up from the anemic level in the first half of 2022 to provide additional support. Third quarter gross domestic product (GDP) is tracking to growth of 1.6% annualized according to the Atlanta Federal Reserve. And although the Institute for Supply Management (ISM) manufacturing survey has been falling much of this year, the expansionary 52.8 reading in July is a positive earnings signal.
In a downside economic growth scenario, something below our 2022 earnings forecast of $225 is possible. An official recession in 2023 is also possible—our odds stand at 50%. Also, consider higher taxes from the Inflation Reduction Act will likely trim $2 to $3 off next year’s S&P 500 Index earnings, while fewer buybacks in response to the 1% buyback tax may leave share counts higher and therefore EPS slightly lower.
Conclusion
In our Midyear Outlook 2022: Navigating Turbulence, released back in mid-July, we wrote that it was tough to see the bull case through the cloud cover, but that an improved macroeconomic environment may set the stage for higher valuations, further earnings growth, and solid gains for stocks over the rest of the year.
Some of those gains have already come—the S&P 500 is up 6% since the publication was released on July 12, even after Friday’s 3.4% decline. Despite an increasingly hawkish Federal Reserve (Fed), and a seasonally weak month of September right around the corner, we still see more upside for stocks over the balance of 2022. Some inflation relief is likely coming, which can help foster interest rate stability. Corporate America continues to show its resilience. And using history as a guide, seasonal forces and midterm elections should provide a fourth quarter tailwind. However, in the very short term, the market’s direction will likely depend on when the Fed signals its rate hiking campaign will end.
We maintain our year-end fair value S&P 500 target at 4,300-4,400 based on a price-to-earnings ratio of 18-19 times our $235 EPS estimate for 2023. In a soft-ish landing scenario, perhaps a 50% probability at this stage, we see upside to that target range. On the flip side, a potential Fed policy mistake, a possible recession in 2023, and heightened geopolitical tensions present risks to the downside.
Click here to download a PDF of this report.
IMPORTANT DISCLOSURES
This material is for general information only and is not intended to provide specific advice or recommendations for any individual. There is no assurance that the views or strategies discussed are suitable for all investors or will yield positive outcomes. Investing involves risks including possible loss of principal. Any economic forecasts set forth may not develop as predicted and are subject to change.
References to markets, asset classes, and sectors are generally regarding the corresponding market index. Indexes are unmanaged statistical composites and cannot be invested into directly. Index performance is not indicative of the performance of any investment and does not reflect fees, expenses, or sales charges. All performance referenced is historical and is no guarantee of future results.
Any company names noted herein are for educational purposes only and not an indication of trading intent or a solicitation of their products or services. LPL Financial doesn’t provide research on individual equities.
All information is believed to be from reliable sources; however, LPL Financial makes no representation as to its completeness or accuracy.
The Standard & Poor’s 500 Index (S&P500) is a capitalization-weighted index of 500 stocks designed to measure performance of the broad domestic economy through changes in the aggregate market value of 500 stocks representing all major industries.
The PE ratio (price-to-earnings ratio) is a measure of the price paid for a share relative to the annual net income or profit earned by the firm per share. It is a financial ratio used for valuation: a higher PE ratio means that investors are paying more for each unit of net income, so the stock is more expensive compared to one with lower PE ratio.
Earnings per share (EPS) is the portion of a company’s profit allocated to each outstanding share of common stock. EPS serves as an indicator of a company’s profitability. Earnings per share is generally considered to be the single most important variable in determining a share’s price. It is also a major component used to calculate the price-to-earnings valuation ratio.
All index data from FactSet.
This research material has been prepared by LPL Financial LLC.
Securities and advisory services offered through LPL Financial (LPL), a registered inv estment advisor and broker -dealer (member FINRA/SIPC). Insurance products are offered through LPL or its licensed affiliates. To the extent you are receiving investment a dvice from a separately registered independent investment advisor that is not an LPL affiliate, please note LPL makes no representation with respect to such entity.
| Not Insured by FDIC/NCUA or Any Other Government Agency | Not Bank/Credit Union Guaranteed | Not Bank/Credit Union Deposits or Obligations | May Lose Value |
RES-1254000-0822 | For Public Use | Tracking # 1-05320221 (Exp. 08/23)