This year has been tough for investors, not just because stocks have fallen but also because bonds have not helped mitigate those losses as they have historically done. Below we discuss the outlook for diversified portfolios of stocks and bonds to make the case that the 60/40 portfolio isn’t dead. It may have been wounded this year, and took another blow on Friday after the hotter-than-expected inflation data, but we believe the losses in stocks and bonds this year increase the chances of positive outcomes going forward. Long-term investors take note.
Tough year for the traditional 60/40 portfolio
It’s been a tough year so far for a traditional “60/40” portfolio, a portfolio of 60% stocks and 40% bonds. Using the S&P 500 Index and the Bloomberg U.S. Aggregate Bond Index (“Agg”) to represent stocks and bonds, the traditional 60/40 was down 15% as of market close on June 10 on a total return basis. If the year ended now, that loss would trail only 2008 as the worst year on record (the Agg’s first year was 1976).
Bonds have typically seen gains during historical periods of equity volatility, although not always. But low bond yields in 2020 and 2021 and steep bond losses due to rising rates in 2022 have led many to speculate that the 60/40 portfolio is dead. But there’s something of a silver lining in the declines. Recent stock and bond losses have improved valuations for the 60/40 portfolio considerably, based on a combination of the price-to-earnings ratio for the S&P 500 and the yield for the Agg. Valuations aren’t an effective market timing mechanism, but they are an important consideration for longer-term return expectations, and that picture has improved quite a bit.
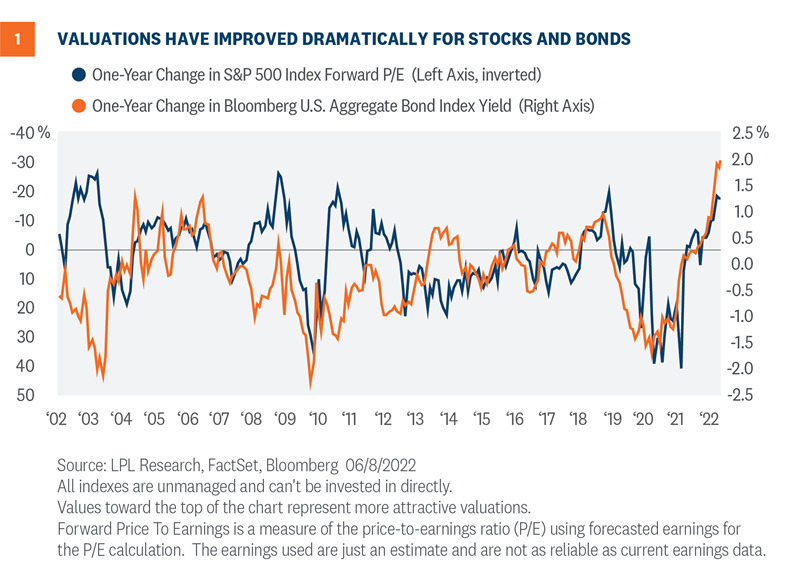
The time to talk about the death of the 60/40 portfolio was six months to a year ago, and even then it was probably exaggerated. The 60/40 portfolio may not get back to the level of returns we’ve seen over the last several decades, but over the last year the 10-year outlook for the 60/40 has improved by about 2 percentage points annualized in our view, about as big a one-year improvement as we’ve seen at any time in the last 20 years, as shown in Figure 1.
Five points of perspective
For the many investors whose experience this year has them questioning the value of the traditional 60/40 portfolio, here are five things that provide perspective.
1) What we’ve seen in 2022 so far is unusual
Since the inception of the Agg in 1976, the S&P 500 has been down over a calendar year eight times. The Agg was higher every single time (although only by 0.01% in 2018). Those were also the worst eight years for 60/40 performance. From the bond perspective, the Agg has been negative four times in its history, the worst year being a 2.9% decline in 1994. It’s a small sample, and isn’t holding so far this year, but the S&P 500 was higher every time with an average gain over 20%.
2) The picture is a little more complicated when looking at quarterly data
Since 1976, the S&P 500 has had 50 negative quarters. The Agg has been lower in 16 of them. The worst quarter for the 60/40 was the fourth quarter of 2008, driven by stock losses. The Agg was actually higher that quarter. The worst quarter for the 60/40 in which the Agg was negative was the third quarter of 1981, with the 60/40 down 7.8%. As of June 8, the current quarter would be but the twelfth worst for the 60/40 overall, mostly due to prior quarters that saw heavy stock declines, and the second worst for the 60/40 when the Agg had a negative quarter, trailing only the third quarter of 1981.
3) Bonds can go down too, even when stocks do
Using quarterly data, the historical correlation between the S&P 500 and the Agg is close to zero. Stocks and bonds tend to each go their own way relative to average performance rather than moving in decidedly opposite directions. It’s also important to remember that bonds, just like stocks, sometimes decline. The S&P 500 has been lower 27% of all quarters over the lifetime of the Agg; By comparison, the Agg has been lower 23% of all quarters, a relatively small difference. When the S&P 500 is down in a quarter, the Agg is down 32% of the time.
4) Stock valuations have improved dramatically
The forward price-to-earnings ratio (P/E) for the S&P 500 as of the end of May 2021 was 21.2 according to FactSet data. On June 8, helped by higher earnings and not just lower stock prices, it was down to 17.4. As seen in Figure 1, that’s an improvement of 18%, while Friday’s losses bring that number closer to 20%. (P/Es improve as they fall, since stocks are “cheaper” relative to earnings.) That decline translates into almost a 2 percentage point improvement in the annual return expectation of the S&P 500 over the next 10 years, although many factors can strongly influence the actual outcome. Outside of earlier this year, that’s the fastest one-year improvement in the forward P/E since 2009. Even with the dramatic decline in P/E, S&P 500 valuations are still slightly above their historical average, but the improvement is meaningful.
Bond valuations have improved dramatically too. The yield on the Agg as of the end of May 2021 was 1.50%. On June 8 it was 3.53%. This is the fastest one-year improvement in yields since 1995. That likewise represents an improved annual expected return of roughly 2 percentage points over the next 10 years. There are factors that can make the actual outcome differ from the expectation here as well, but the difference is less variable than for stocks simply because you know the price you’ll get for a bond at maturity.
5) Dislocations create opportunities for strategic investors
We’ve been focusing here on the S&P 500 Index, perhaps the most well-known and widely used stock index in the world. But it’s not the only area of the market where stock valuations have improved, and some may offer even better value. Despite its improvement, the S&P 500’s P/E is still in the 82nd percentile of all values going back 20 years, according to FactSet data, with higher percentiles representing less attractive valuation. But there are areas of the market that are in the 10th percentile or lower of all values over the same timeframe and sitting near levels only seen during the Great Financial Crisis and in March of 2020. Prospects for long-term returns for small caps have improved, for example, as valuations have dipped well below long-term averages.
Similarly, there are pockets of the bond market seeing unusually high yield levels relative to the past decade. For both stocks and bonds, attractive valuations tend to be accompanied by very challenging economic conditions, but the most opportune moments often are. Where we see the best strategic opportunities is a piece for another day, but pockets of even more attractive, even extreme, valuations do suggest that for long-term investors there may be ways to further diversify a traditional 60/40.
Conclusion
Recent changes in valuations have improved the outlook for a traditional 60/40 portfolio considerably, in our view, on both the stock side and the bond side. We do think of the traditional 60/40 portfolio only as a starting point for an appropriate investor. And even if the traditional 60/40 portfolio is very much alive, as we believe, there may still be opportunities to improve the risk profile of a portfolio, whether through greater diversification within stock or bond holdings, active management, or investment opportunities outside of traditional stocks and bonds.
It’s been a tough year for many investors, and we don’t think we’re in a position yet to call a tactical bottom for either stocks or bonds despite last week’s losses. But looking out strategically, based on better valuations and still mostly favorable fundamentals, we think the long-term outlook has brightened quite a bit.
Click here to download a PDF of this report.
IMPORTANT DISCLOSURES
This material is for general information only and is not intended to provide specific advice or recommendations for any individual. There is no assurance that the views or strategies discussed are suitable for all investors or will yield positive outcomes. Investing involves risks including possible loss of principal. Any economic forecasts set forth may not develop as predicted and are subject to change.
References to markets, asset classes, and sectors are generally regarding the corresponding market index. Indexes are unmanaged statistical composites and cannot be invested into directly. Index performance is not indicative of the performance of any investment and does not reflect fees, expenses, or sales charges. All performance referenced is historical and is no guarantee of future results.
Any company names noted herein are for educational purposes only and not an indication of trading intent or a solicitation of their products or services. LPL Financial doesn’t provide research on individual equities.
All information is believed to be from reliable sources; however, LPL Financial makes no representation as to its completeness or accuracy.
U.S. Treasuries may be considered “safe haven” investments but do carry some degree of risk including interest rate, credit, and market risk. Bonds are subject to market and interest rate risk if sold prior to maturity. Bond values will decline as interest rates rise and bonds are subject to availability and change in price.
The Standard & Poor’s 500 Index (S&P500) is a capitalization-weighted index of 500 stocks designed to measure performance of the broad domestic economy through changes in the aggregate market value of 500 stocks representing all major industries.
The Bloomberg Aggregate U.S. Bond Index represents securities that are SEC-registered, taxable, and dollar denominated. The index covers the U.S. investment-grade fixed rate bond market, with index components for government and corporate securities, mortgage pass-through securities, and asset-backed securities.
The PE ratio (price-to-earnings ratio) is a measure of the price paid for a share relative to the annual net income or profit earned by the firm per share. It is a financial ratio used for valuation: a higher PE ratio means that investors are paying more for each unit of net income, so the stock is more expensive compared to one with lower PE ratio.
Forward Price to Earnings is a measure of the price-to-earnings ratio (P/E) using forecasted earnings for the P/E calculation. While the earnings used are just an estimate and are not as reliable as current earnings data, there is still benefit in estimated P/E analysis. The forecasted earnings used in the formula can either be for the next 12 months or for the next full-year fiscal period.
Earnings per share (EPS) is the portion of a company’s profit allocated to each outstanding share of common stock. EPS serves as an indicator of a company’s profitability. Earnings per share is generally considered to be the single most important variable in determining a share’s price. It is also a major component used to calculate the price-to-earnings valuation ratio.
All index data from FactSet.
This research material has been prepared by LPL Financial LLC.
Securities and advisory services offered through LPL Financial (LPL), a registered inv estment advisor and broker -dealer (member FINRA/SIPC). Insurance products are offered through LPL or its licensed affiliates. To the extent you are receiving investment a dvice from a separately registered independent investment advisor that is not an LPL affiliate, please note LPL makes no representation with respect to such entity.
| Not Insured by FDIC/NCUA or Any Other Government Agency | Not Bank/Credit Union Guaranteed | Not Bank/Credit Union Deposits or Obligations | May Lose Value |
RES-1184900-0622 | For Public Use | Tracking # 1-05292377 (Exp. 06/23)