At the risk of sounding cliché, making the case for stocks to stage a second half rally back to the prior highs requires investors to see through some heavy cloud cover. If you prefer another market cliché, it’s times like these when investors need a crystal ball. We fully acknowledge how tough it is to see the bull case for stocks right now, and a retest of recent lows is certainly possible, but this week we lay out the bull case for the second half of the year. It starts with inflation.
The Wall of Worry is Tall
Needless to say, it’s been a tough year. The S&P 500 Index started 2022 with its worst first 100 days since 1970. There is no shortage of bearish headlines. Some of the smartest investors out there are urging caution and calling for recession (though Warren Buffett has been buying). The anxiety among investors is understandable given stock market losses, sky-high inflation, and rising recession risk. Consumer buying power is being eroded by sharply higher prices. The stimulus cavalry is not coming to the rescue. Wages are rising, and while good for consumer buying power, that worries the Federal Reserve (Fed). Materials and transportation costs are rising rapidly as supply chains remain snarled and China’s lockdowns are ongoing. It’s tough out there.
Adding to the angst, the Fed’s track record of fighting inflation without causing a recession is not good. More often than not, its rate hiking campaigns have preceded (or caused) recessions—though typically at higher interest rates than we are seeing today. Nonetheless, high inflation has been a common ingredient in recessions since WWII—see the 1970s, early 1980s, early 1990s, and even 2008. Simply put, the Fed is fighting an uphill battle.
So how can we still like stocks here? We’ll give you three key reasons.
Bull Case #1: Inflation Pressures will LIKELY Ease
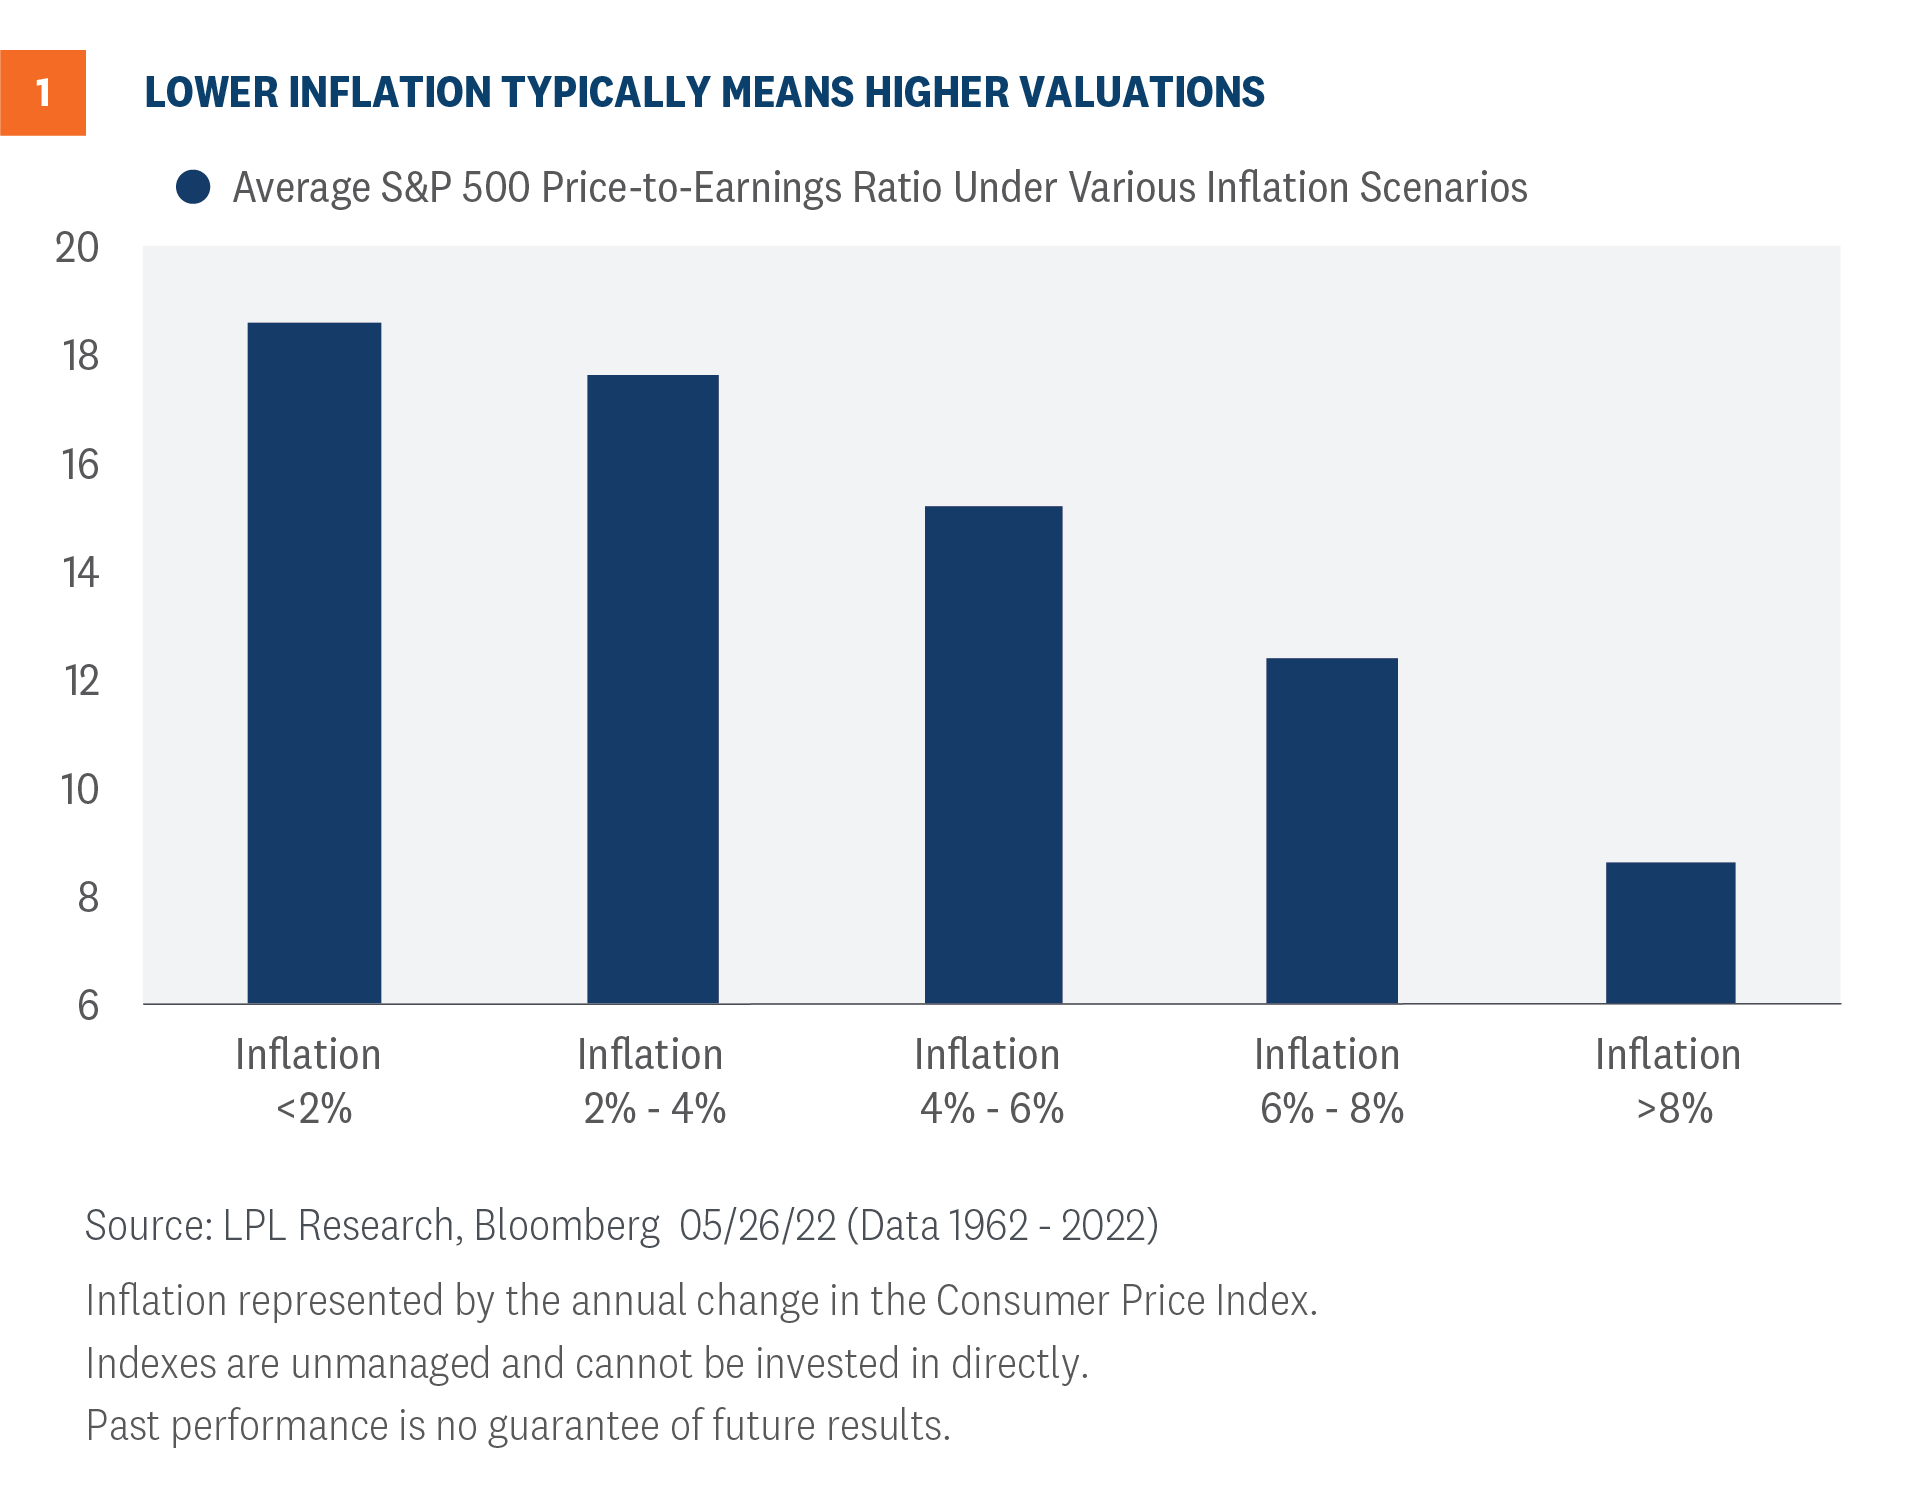
The amount of time it takes for stocks to return to prior highs will be determined by the path of inflation. LPL Research expects perhaps 1.5 percentage points to come off core consumer prices by year-end—the latest reading for the Fed’s preferred inflation measure, the Core Personal Consumption Expenditures (PCE) Index, excluding food and energy, was 4.9%.
It’s fair to say a lot has to go right for that to happen, including easing supply chain disruptions, more workers entering the labor force, and a cease-fire in Ukraine. But our view is progress on these fronts over the next seven months is more likely than not. As shown in Figure 1, lower inflation tends to bring higher valuations.
Bull Case #2: Corporate America Enjoying Solid Earnings Momentum
We just got through first quarter earnings season and while it wasn’t pretty, the S&P 500 earnings growth rate (9.3%), the percentage of companies beating earnings estimates (78%), and the change in the consensus next 12 months estimate for the S&P 500 during reporting season (+0.5%) were all excellent. Revenue growth exceeded 13% on a year-over-year basis, as companies were able to generally pass through price increases, limiting pressure on profit margins.
There were some high profile misses, particularly among retailers, and energy certainly helped prop up the numbers (about 6 points of impact on overall S&P 500 earnings), but given the challenges of cost pressures, labor and materials shortages, and supply chain disruptions, companies did an excellent job managing through a challenging environment.
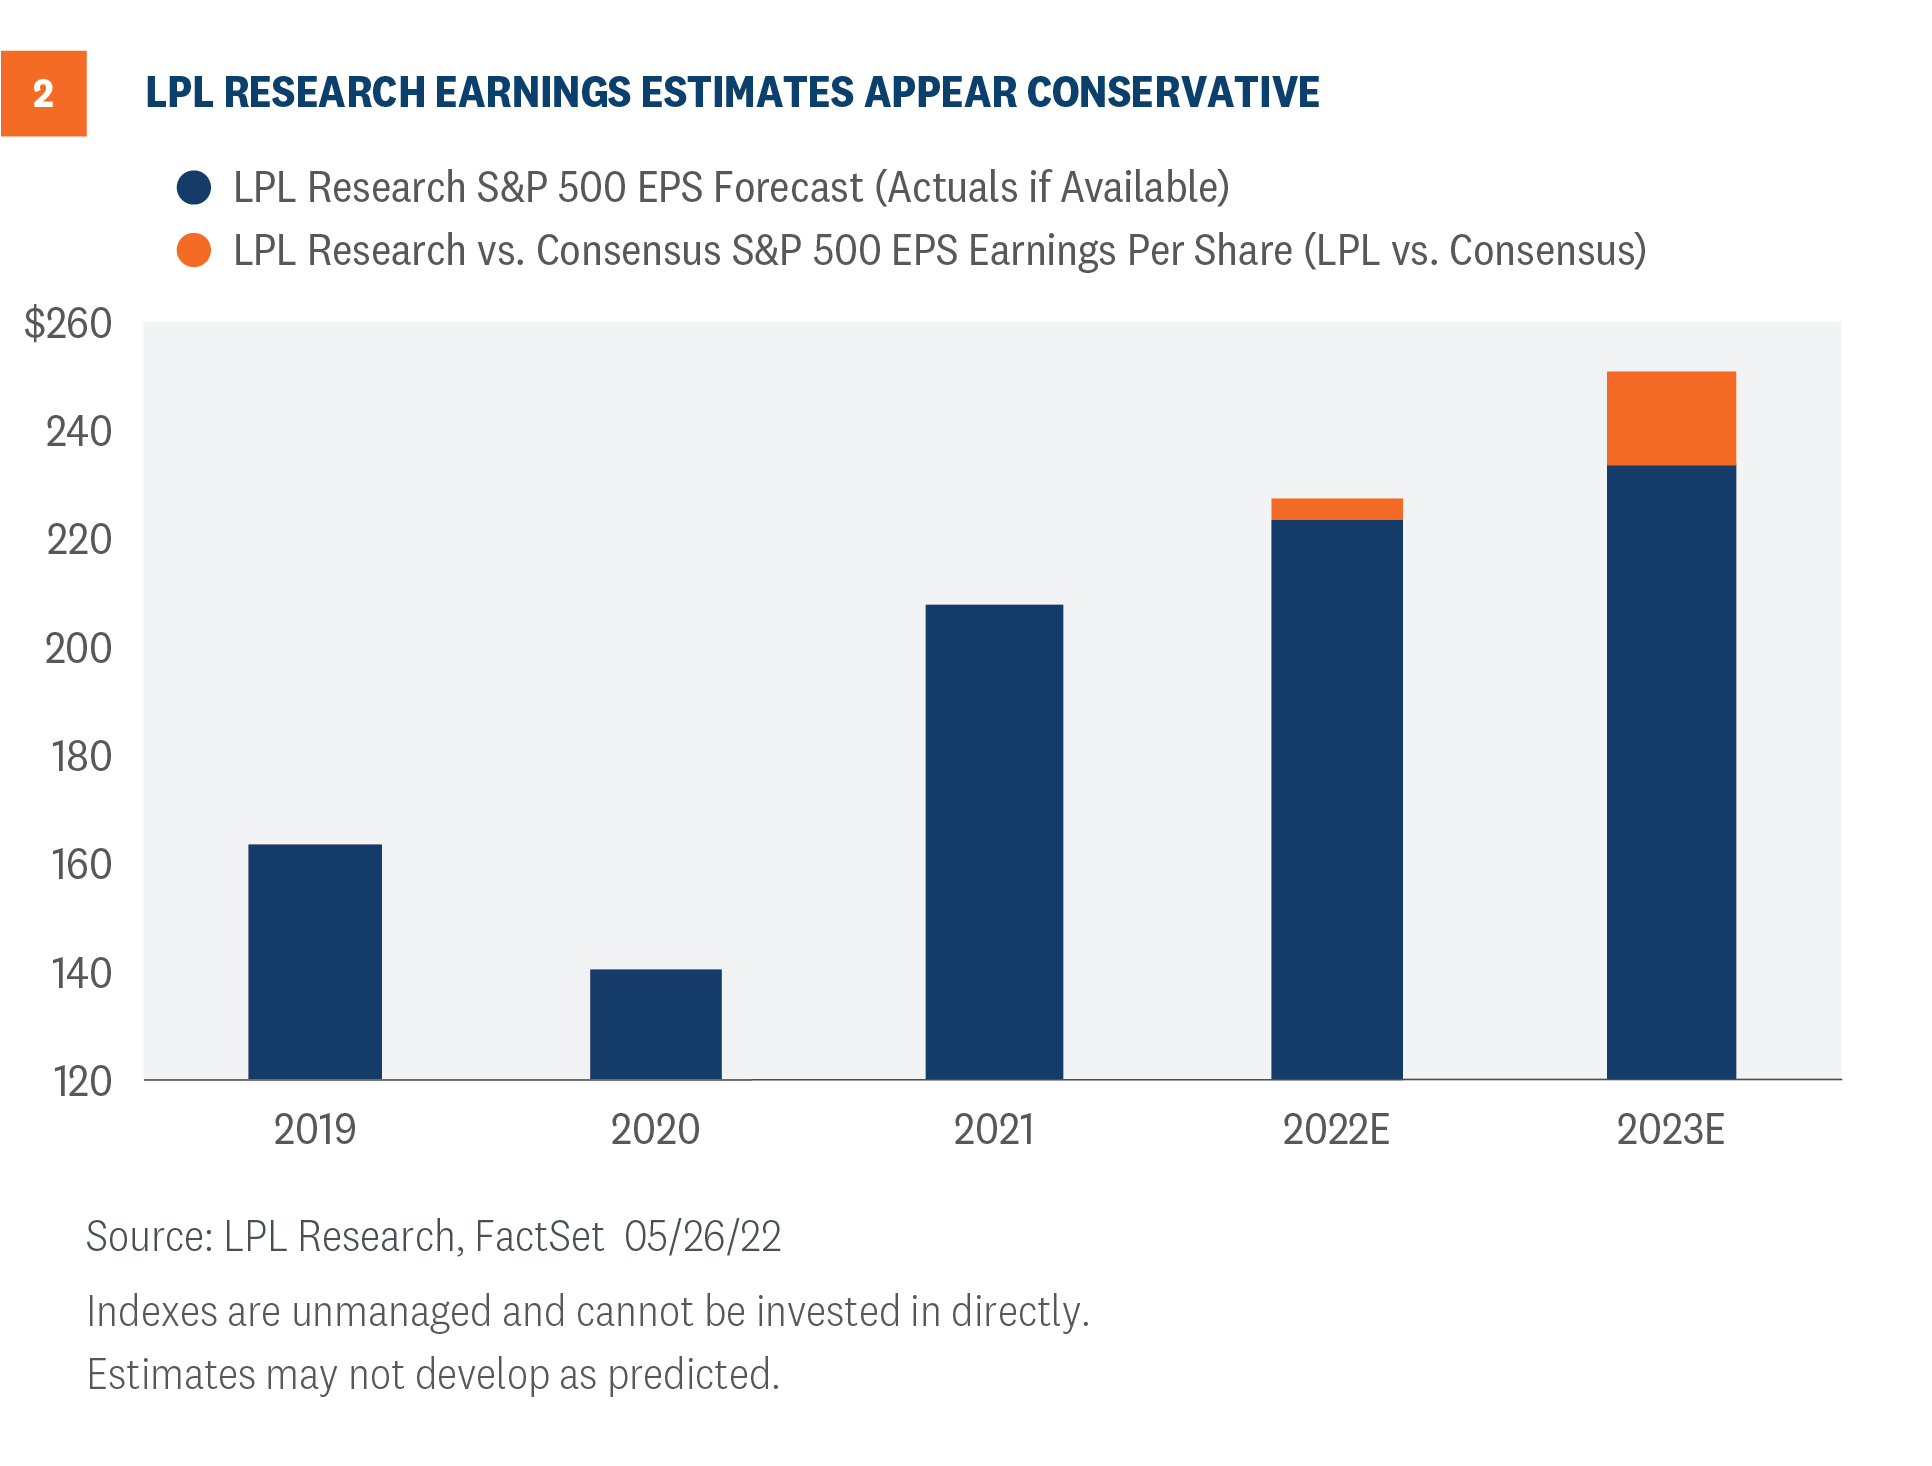
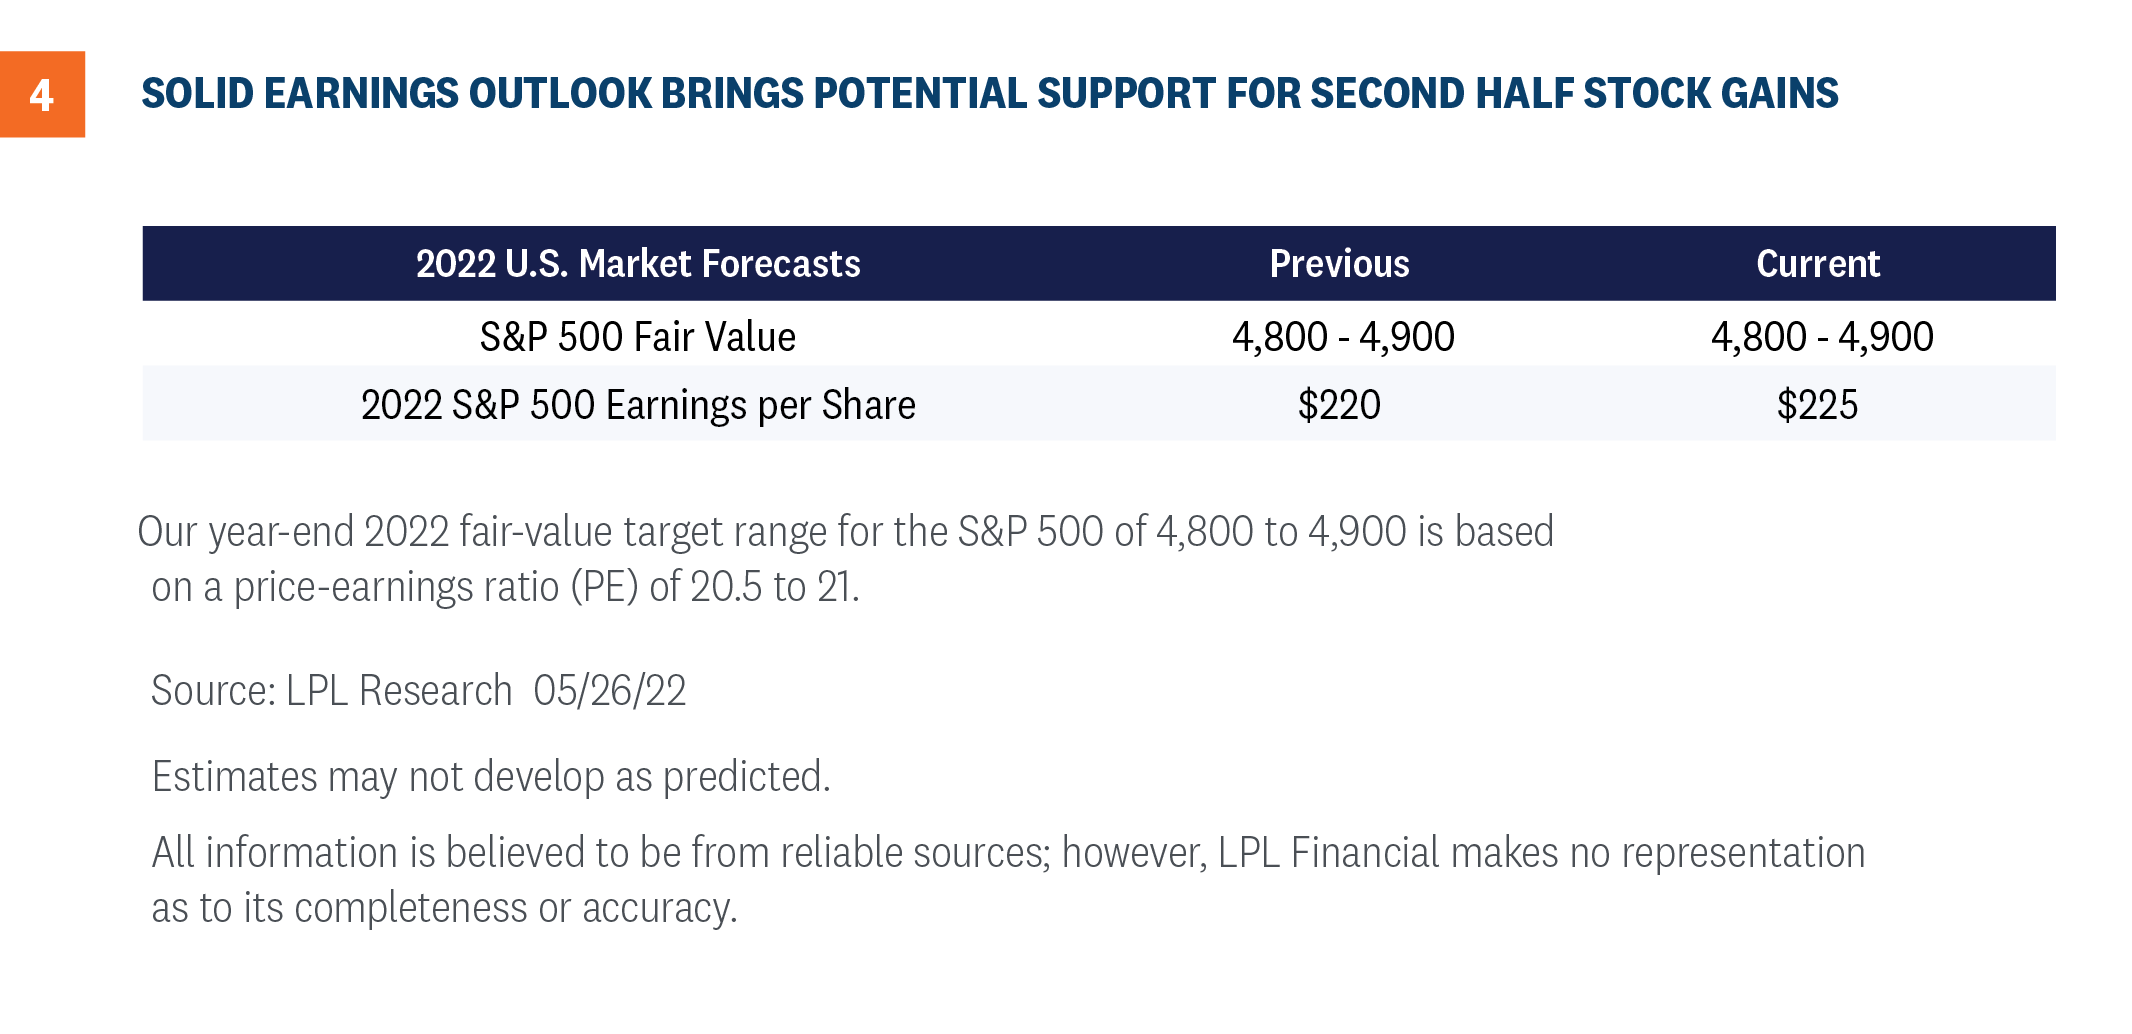
Solid first quarter results set corporate America up to potentially exceed our $220 per share earnings estimate for the S&P 500 in 2022, so we are officially raising our forecast to $225. As Figure 2 illustrates, our forecast is still about $5 below the consensus estimate. Our $235 per share forecast for 2023, which is probably too low, is now more than $16 below the consensus estimate. We expect mid-to-high single-digit earnings growth in coming quarters to help support a stock market turnaround beginning this summer.
Bull Case #3: Valuations are too Low
Lower inflation supports higher valuations, as illustrated in Figure 1. The same can be said for interest rates, as lower rates increase the value of future profits and make stocks more attractive relative to bonds. So if inflation comes down in the coming months as we expect, interest rates are likely to stay in this range (our year-end forecast for the 10-year U.S. Treasury yield is 2.25—2.5%).
We also believe that stocks, at recent lows, were pricing in perhaps as much as a 50% chance of recession over the next year based on the magnitude of the stock market’s decline. We see the odds of a recession in the United States during this time frame as lower than that (perhaps one in three, if not lower). We expect valuations to recapture some of the lost ground by year-end as markets come around to our view that this is a growth scare and recession is not imminent. That process to get there may not be smooth for markets, especially over the next month or so, but we think it happens over the balance of the year.
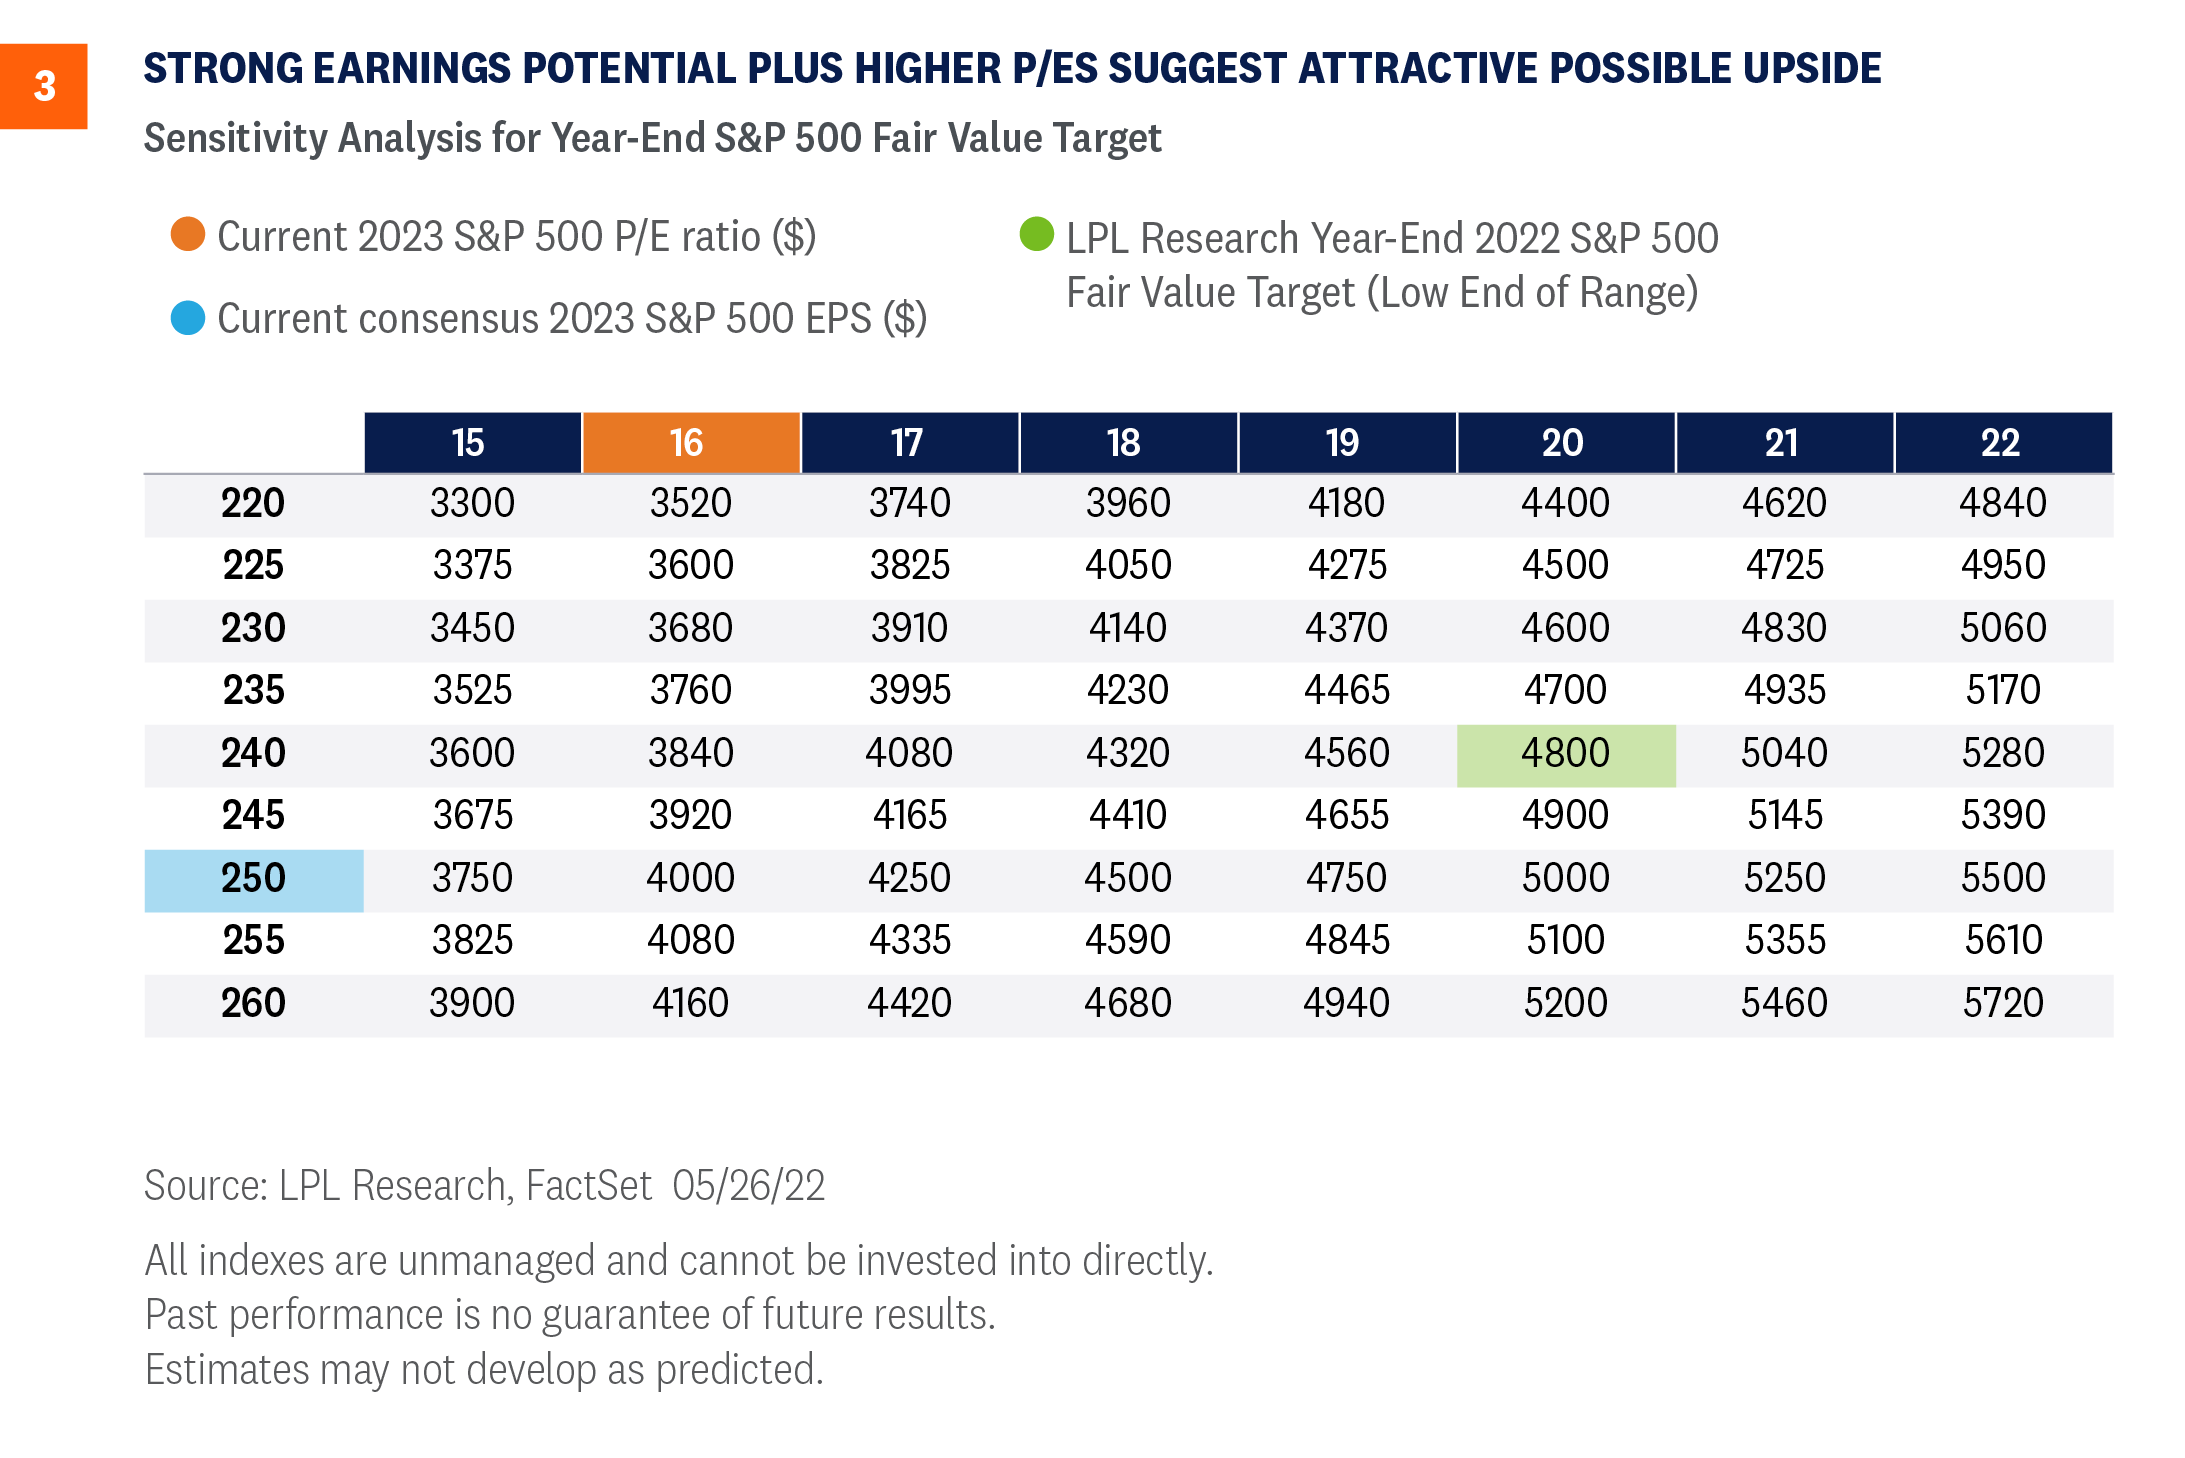
In the absence of recession, earnings growth plus valuation expansion can be a powerful combination. Figure 3 shows that stocks don’t have to get back to prior peak valuations, nor do earnings have to reach next year’s consensus levels for the index to get back into the green by year-end. Our 4,800 target on the S&P 500 could potentially be reached with a 20 P/E and $240 in EPS in 2023 ($11 below consensus), or 19 times the consensus number around $251, though we acknowledge that earnings number is probably too high. Keep in mind the index entered this year at over 21 times 2022 earnings estimates. The latest rebound off the lows has lifted the next 12 months P/E to over 17.
Conclusion
We continue to prefer a modest overweight allocation to equities and a slight underweight to fixed income relative to investors’ targets, as appropriate. Our year-end 2022 fair value target for the S&P 500 is 4,800–4,900, 15% above the May 27 closing price at the low end. Our continued optimism is based largely on our expectation of continued economic and earnings growth, i.e., no recession, and lower inflation over the balance of 2022.
We are considering adding to our equities allocation but are waiting for either more evidence that inflation is coming down or for technical analysis signals that have often accompanied major market lows. We would not be surprised by a retest of recent lows in the short term, but for suitable long-term investors, this could be a good entry point. Those more defensively positioned may want to consider nibbling here. Those with higher risk tolerances may consider adding at the next dip.
Click here to download a PDF of this report.
______________________________________________________________________________________________
IMPORTANT DISCLOSURES
This material is for general information only and is not intended to provide specific advice or recommendations for any individual. There is no assurance that the views or strategies discussed are suitable for all investors or will yield positive outcomes. Investing involves risks including possible loss of principal. Any economic forecasts set forth may not develop as predicted and are subject to change.
References to markets, asset classes, and sectors are generally regarding the corresponding market index. Indexes are unmanaged statistical composites and cannot be invested into directly. Index performance is not indicative of the performance of any investment and does not reflect fees, expenses, or sales charges. All performance referenced is historical and is no guarantee of future results.
Any company names noted herein are for educational purposes only and not an indication of trading intent or a solicitation of their products or services. LPL Financial doesn’t provide research on individual equities.
All information is believed to be from reliable sources; however, LPL Financial makes no representation as to its completeness or accuracy.
U.S. Treasuries may be considered “safe haven” investments but do carry some degree of risk including interest rate, credit, and market risk. Bonds are subject to market and interest rate risk if sold prior to maturity. Bond values will decline as interest rates rise and bonds are subject to availability and change in price.
The Standard & Poor’s 500 Index (S&P500) is a capitalization-weighted index of 500 stocks designed to measure performance of the broad domestic economy through changes in the aggregate market value of 500 stocks representing all major industries.
The PE ratio (price-to-earnings ratio) is a measure of the price paid for a share relative to the annual net income or profit earned by the firm per share. It is a financial ratio used for valuation: a higher PE ratio means that investors are paying more for each unit of net income, so the stock is more expensive compared to one with lower PE ratio.
Earnings per share (EPS) is the portion of a company’s profit allocated to each outstanding share of common stock. EPS serves as an indicator of a company’s profitability. Earnings per share is generally considered to be the single most important variable in determining a share’s price. It is also a major component used to calculate the price-to-earnings valuation ratio.
The PCE Price Index Excluding Food and Energy, also known as the core PCE price index, is released monthly. The core index makes it easier to see the underlying inflation trend by excluding two categories – food and energy. – where prices tend to swing up and down more dramatically and more often than other prices.
The Consumer Price Index (CPI) is a measure of the average change over time in the prices paid by urban consumers for a market basket of consumer goods and services.
All index data from FactSet.
This research material has been prepared by LPL Financial LLC.
Securities and advisory services offered through LPL Financial (LPL), a registered inv estment advisor and broker -dealer (member FINRA/SIPC). Insurance products are offered through LPL or its licensed affiliates. To the extent you are receiving investment a dvice from a separately registered independent investment advisor that is not an LPL affiliate, please note LPL makes no representation with respect to such entity.
| Not Insured by FDIC/NCUA or Any Other Government Agency | Not Bank/Credit Union Guaranteed | Not Bank/Credit Union Deposits or Obligations | May Lose Value |
RES-1172300-0522 | For Public Use | Tracking # 1-05288087 (Exp. 05/23)